To do any of the stuff explained on this page you will need a copy of the scripts for running experiments. I've made a wraped package which you can download from here: redexpdist.tgz
Network setup.
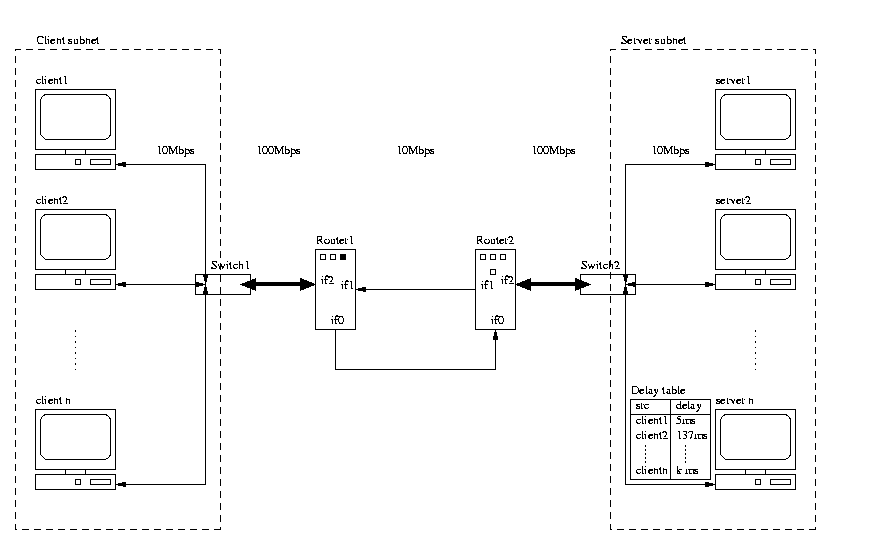
Figure 1. shows an overview of the network setup. On one side of the routers the clients run and on the other side the servers run.
The interesting thing is that the delay is introduced only in one direction, and that it in principle could be done anywhere in the network.
We should also mention that the delays are handled my the firewall in freebsd called ipfw.
To run a specific queue management algorithm we need to run a daemon that attaches the the kernel on the router. There is a separate daemon for each of the queuing mechanisms: fifoqd and redd.
On the queue management algorithm we have some specialized tools for monitoring the queuing mechanism and the general throughput of the router. These are called: fifoqstat and redstat, just as in the altq distribution, except these are modified from the original versions from altq-1.2. Notice that these tools will build up a log in memory and flush this to disk when the timeout occurs, meaning that if you kill these tools then you won't get any data in the logfile.
On the congested link carrying traffic from router 2 to router 1 we have a monitor which measures the number of bytes passing through the link pr second. This tool is called ifmon.
The remaining data is collected by the simulators, and mainly by the
client simulator.
The organization of experiments is done by having a separate directory for each experiment. Avoid changing any of the original log or configuration files. Plots from post processing are placed in a sub directory called plots.
Log files are Always written to local disk, and copied to a central disk when the experiment is completed. During an experiment the must be NO extra traffic, since this may have a significant impact on the performance of the experiments.
During the past two years we've built up a collection of scripts that
supports running and analyzing
the experiments, in general there are three categories of scripts:
setting up the network, running the experiments, and post prossing the
log files. Especially the post prossing scripts expect certain log and
configuration files to be present in the experiment directory. The reason
for this high dependence on certain files is that this makes it possible
to automate things like setting of titles on the generated plots.
It should be mentioned that these scripts are not industrial strength
scripts, which basically means that
there may be unknown bugs and they do write debugging output when being
executed.
Feel free to fix/modify or extend your personal copy of the scripts
in anyway you want.
Note that this script runs as root.
Example:
bin/setupnet -f setup/netconfig.ave
Before you can start running anything you will need a netconfig.ave dedicated to the network you will be using.
We usually only run this script once for each set of experiments. That is once every time someone else has used the network.
If you are sure that the kernels weren't changed and that there are no hanging processes, you can comment out the section telling setupnet to reboot the hosts.
Be sure to take a close look at the output before starting an experiment. And be sure to save the output for future reference.
# where to put all the logfiles (local disk space)
logdir: /usr/home2/mixxel
# the network configuration file. (will be copied
to $logdir/net.config)
netconfig: /home/mixxel/red/setup/netconfig.ave
# rrdata: central, remotes
rrdate:yosemite139,goddard134,floyd134,goober134,thelmalou134
rrdate:yosemite139,roadrunner134,yako134,wako134
rrdate:yosemite139,brain138,taz138,lovey138,speedy138
rrdate:yosemite139,petunia138,tweetie138,howard138
rrdate:yosemite139,daffy139,bollella139
# hosts on which all nfs mounts are umounted during
the experient
umount:daffy139,bollella139
# sysctl:hostlist:pattern
# hostlist is a comma seperated list
# pattern is the grep "pattern" in the sysctl lines
# results will go into sysctl.log
sysctl: daffy139, bollella139:intr
# netstat: hostlist:netstat options
# hostlist is a comma seperated list
# netstat is syntactical sugar and will be replaced
with netstatbin
# options is the options that you wan't to pass to
netstat
# results will go into netstat.log
netstat: daffy139,bollella139 : netstat -d -I fxp0
netstat: daffy139,bollella139 : netstat -d -I fxp1
netstat: daffy139,bollella139 : netstat -d -I fxp2
netstat: goddard134,floyd134,goober134,thelmalou134:netstat
-p tcp
netstat: roadrunner134,yako134,wako134:netstat -p
tcp
netstat: brain138,taz138,lovey138,speedy138:netstat
-p tcp
netstat: petunia138,tweetie138,howard138: netstat
-p tcp
# router: host, command
# (remember not to use -d - that will cause to runtest
to hang)
router: daffy139,fifoqd -l 190 xl0
#routermon: host, command,timeout;
#sample at a rate of 2ms (-i option) and make a log
entry for every 100ms
routermon: daffy139,fifoqstat -i 2000 -l 100 -s 5460
xl0
#ifmon: host,interface,interval (ms)
ifmon: yosemite139,fxp2,1000
# tcpdump: host, cmd
# note: tcpdump will be substituted with tcpdumpbin
# note: do not use full path in -w option (It will
be put in logdir)
#tcpdump: yosemite139,tcpdump -i fxp2 -w tcpdump139.log
#tcpdump: yosemite139,tcpdump -i fxp1 -w tcpdump138.log
# server: name,timeout (secs)
server: floyd134,5460
server: goober134,5460
server: thelmalou134,5460
server: roadrunner134,5460
server: goddard134,5460
server: yako134,5460
server: wako134,5460
# client: name,browsers,timeout (secs)
client: howard138,438,5400
client: lovey138,438,5400
client: speedy138,438,5400
client: brain138,438,5400
client: petunia138,438,5400
client: taz138,438,5400
client: tweetie138,437,5400
resultdir:/net/buzzard/dirt-playpen/mixxel/fifo3/fifo61.190.3065
description: fifo61.190.3065 runs for 5400 secs with
3065 browsers
The script that uses a configuration file like this one is called "bin/runtest".
Before you can run any experimetns with runtest you first need to make
you own version of the config file, where you modify the
hostnames and the interfaces used for the router and monitors.
Also you will need to check though the beginning of runtest, making sure that all the paths points to binaries that are present.
runtest also runs as root because runtest includes code for unmounting nfs mounted the file systems on the routers - you may choose not to use this feature by commenting out the umount section.
rdate is a small program that synchronizes the clock on all the machines in the setup.
The directory called LOGDIR should exists on all the hosts in the experimental network before starting and experiment. This is always the same directory and old log files will be overwritten when a new experiment is started. Sometimes runtest expects local versions of the binaries such as fifoqd and redd and their stats tools.
Be sure the root has write access to resultdir and that this directory exists before runtest is executed, this is needed because runtest collects all the log files in the resultdir when the experiment completes.
While debugging your config files it can be useful to reduce the length
of the experiment to 5minutes....just
be sure to make the change in all the lines that requires a time-out
period.
We use a script called runrunrun which does the above mentioned for each file in a directory. This allows one to add extra experiments while an experiment is running. You can also control the job execution by touching a file called "stop" or "wait" in the directory with the experiment configurations. To continue simply remove the "stop" or "wait" file.
see: bin/runrunrun -?
When an experiment has completed you should have the following files in the resultdir:
catalyst.log
# output from the catalyst scripts
client_<client host>.log
# primary client log file
clients.log.gz
# standard error from all the clients
dl_<client host>.log
# secondary client log file (binary format - read by calling thttp -rf
<logfile>)
fifo20.15.3353
# experiment configuration file
ifmon.log.gz
# log from the bandwidth utilization tool called ifmon
ifmonerr.log.gz
# std err from the ifmon tool
net.config
# your network configuration which is used by setupnet
netstat.log.gz
# output from netstat
<server host>.log
# logfiles from servers
router.log.gz
# std err from the routermonitor
routermon.log.gz
# the router monitor logfile
servers.log.gz
# stderr from the servers
sysctl.log.gz
# output from the sysctl command
If any of these logfiles are missing, especially net.config or fifo20.15.3353
is missing, then the post processing scripts will fail.
Do all will produce the following xplots in resultdir/plots (the ones in bold is the most frequently used plots):
dl_cdf.xpl.gz
# the response time CDF
cdf_interval.xpl.gz # the response time CDF
where requests are catagorized by reply size 0b-2880b,2880b-27514b,27514b-2Mb
dl_rsp.xpl.gz
# response times over time averages in 1 second intervals
ifmon.xpl.gz
# linkutilization plot over time
packets.xpl.gz
# packets per 1/10 of a second plots
qlen.xpl.gz
# queue length plots
qlen_cdf.xpl.gz
# queue length CDF plots
rsp.xpl.gz
# response time over time avereraged pr second
thruput_cdf.xpl.gz # cdf of the throughput
Scripts in "plot" that may come in handy:
plot/combine_cdfs
# a script that can combine several cdfs into a single xpl file, do a -?
option to get the options
plot/rmon2R
# converts the routermon.log into a table which can be read by the tool
R (a free s+ clone)
plot/xpl2gnuplot
# a tool that can convert xpl files into gnuplot files. (experimental)
plot/xpl2ss
# a tool that can convert an cdf xpl file to a spread sheet format - almost
equal to rmon2R
plot/*.pm
# various perl modules used by the scripts...
The scripts for calculating the statistics are in the "stats"
directory. The main script is the one called
"calcstats". There are some files with extension .Rcode, these are
simple scripts for R, used by calcstats.
NOTE: when calcstats uses R it will consume more than 300MB memory!
To calculate the stats we use the tool called R. R works on tables with data. So to load the data we convert all the response time measurements and routermon measurements into two files rsptimes.Rdata (using plot/dl_cdf with the -t option) and routermon.Rdata. These files are quite large so you may not want to save them once the stats has been calculated, since you can always regenerate them from the raw data.
Calcstats allows one to pass arguments regarding the configuration of
the router, so that these are included
in the stats file for the experiment. There is also an ID field which
allows you to give the line a unique identifier.
do a: calcstats -? to see the options.
The stats file has the following statistics for an experiment:
| type | type e.g. fifo or red |
| id | the unique id of this exp |
| qlen | queue length (packets) |
| wq | 1/wq |
| maxp | 1/maxp |
| minth | minimum threshold (packets) |
| maxth | maximum threshold (packets) |
| median_rsptime | median response time for all requests (ms) |
| mean_rsptime | mean response time for all requests (ms) |
| mean_rsptime1 | mean response time for all requests that complete within 1s and has a reply size that is smaller then 2.88kb |
| num_reqs1 | number of requests that complete within 1s and has a response size less then 2.88k |
| avg_qlen | the average queue length |
| max_qlen | the maximum queue length seen! |
| xmit_packs_pr_sec | average number of packets xmitted per s |
| xmit_kbps | average number of kbytes xmitted per s |
| drop_packs_pr_sec | average number of packets dropped per s |
| drop_packs | % of packets drop of total number of packets arriving at the router |
| unforced_drops | % of drop_packs that were unforced drops (e.g. early drops) |
| force_drops | % of drop_packs that were force drops (e.g. queue overflow) |
| num_reqs_0-1000ms | % of requests that complete within 1s |
| num_reqs_1000-2000ms | % of requests that complete within the 1-2s interval |
| num_reqs_2000-3000ms | % of requests that complete within the 2-3s interval |
| num_reqs_3000-ms | % of requests that takes more the 3s to complete |
| num_reqs | total number of requests made |