Effect of Noise on Accuracy and Speed in rods

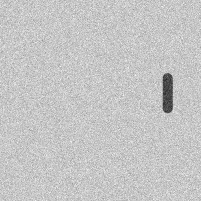
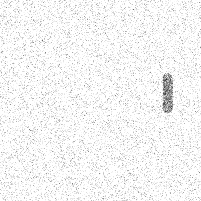
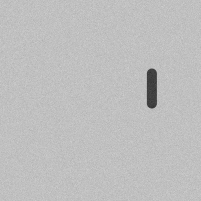
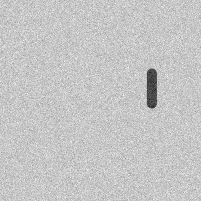
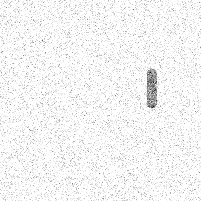
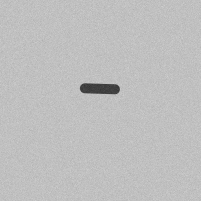
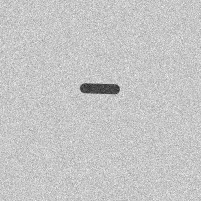
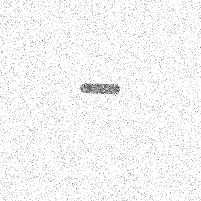
The rods used for these tests are generated algorithmically and then have noise added to them algorithmically. They dark-on-gray rods of radius 5 and length 30. The background is at 75% of maximum brighness and the rods are at 25%. The samples are averaged over a uniform grid that has 100 times the resolution in X and Y of the final image. This should make it possible to precisely localize the rods to 1/100th of a pixel. The added noise is Gaussian noise with the mean and variance specified in the table. In the first table, the rod sits still the whole time (the tracker is not initiated at the rod center); this tests how well it can determine that a rod is in fact sitting still in the presence of noise. In the second table, the rod moves in a circle with the noise added; this tests how well a rod can be followed in the presence of noise. In the third table, the rod moves randomly in X and Y and changes its orientations randomly. For all trials, the Video Spot Tracker precision setting is 0.001 and sample_spacing is 0.1. All trials use a dark cone tracking kernel with a radius of 5; the rod3 kernel has a length of 30.

Test 1: Stationary Rod

Noise Level
Motion
Mean Radial Error
Mean X Error
Mean Y Error
Max Radial Error
X Bias
Y Bias
Mean Angle Error
Max Angle Error
Angle Bias
Estimates/Sec
True Log
VST Log
Images
none
Stationary
0.0308849
0.024922
0.018242
0.0308849
-0.024922
0.018242
0
0
0
4.92168
Log
VST Log
Images
Mean=2 Var=1e4
Stationary
0.030405
0.0247431
0.0174607
0.0391631
-0.0247431
0.0174607
0.00596852
0.018646
-0.00253588
3.92564
Log
VST Log
Images
Mean=20 Var=1e5
Stationary
0.0300929
0.0234735
0.0166513
0.0625993
-0.0234735
0.0162888
0.0237994
0.074615
-0.0015711
3.54691
Log
VST Log
Images
Mean=200 Var=1e6
Stationary
0.0452372
0.0261961
0.0298297
0.15623
-0.0194305
0.0100388
0.0935527
0.246193
0.00268504
3.17899
Log
VST Log
Images
Mean=2000 Var=1e7
Stationary
0.131438
0.0659498
0.101702
0.393246
-0.0125751
0.00019502
0.282375
0.675163
0.0270762
2.89941
Log
VST Log
Images
Mean=20000 Var=1e8
Stationary
0.502901
0.237097
0.413041
1.71041
0.00422176
-0.0816018
0.953066
2.78646
0.284471
2.63655
Log
VST Log
Images


Example images follow:

rod_5_30_sym_stat.0_0.0000.bmp

rod_5_30_sym_stat.2_1e4.0000.bmp

rod_5_30_sym_stat.20_1e5.0000.bmp

rod_5_30_sym_stat.200_1e6.0000.bmp

rod_5_30_sym_stat.2000_1e7.0000.bmp

rod_5_30_sym_stat.20000_1e8.0000.bmp

Test 2: Circular Motion

Noise Level
Motion
Mean Radial Error
Mean X Error
Mean Y Error
Max Radial Error
X Bias
Y Bias
Mean Angle Error
Max Angle Error
Angle Bias
Estimates/Sec
True Log
VST Log
Images
none
Circular
0.0163845
0.0105653
0.010212
0.045901
0.00320041
-0.00560312
0.0314952
0.117096
-0.000148258
2.42269
Log
VST Log
Images
Mean=2 Var=1e4
Circular
0.0172567
0.011197
0.0107141
0.0480692
0.0034476
-0.00585893
0.0314064
0.123795
-6.71083e-005
2.41182
Log
VST Log
Images
Mean=20 Var=1e5
Circular
0.0222573
0.0143774
0.0140803
0.0622251
0.00414742
-0.00637166
0.0398578
0.161957
-0.000250617
2.38354
Log
VST Log
Images
Mean=200 Var=1e6
Circular
0.0487747
0.0305726
0.0317839
0.138059
0.00617381
-0.00793413
0.0940205
0.276031
-0.00226763
2.36176
Log
VST Log
Images
Mean=2000 Var=1e7
Circular
0.142142
0.0881446
0.0932669
0.401981
0.00962431
-0.0147294
0.281866
1.1004
-0.018026
2.42519
Log
VST Log
Images
Mean=20000 Var=1e8
Circular
0.489353
0.310573
0.307356
1.75638
0.0156872
-0.0316484
1.01793
3.6611
-0.0952496
2.41472
Log
VST Log
Images


Example images follow:

rod_5_30_sym_circle.0_0.0000.bmp

rod_5_30_sym_circle.2_1e4.0000.bmp

rod_5_30_sym_circle.20_1e5.0000.bmp

rod_5_30_sym_circle.200_1e6.0000.bmp

rod_5_30_sym_circle.2000_1e7.0000.bmp

rod_5_30_sym_circle.20000_1e8.0000.bmp

Test 3: Random Motion

Noise Level
Motion
Mean Radial Error
Mean X Error
Mean Y Error
Max Radial Error
X Bias
Y Bias
Mean Angle Error
Max Angle Error
Angle Bias
Estimates/Sec
True Log
VST Log
Images
none
Random
0.0210238
0.0151785
0.0118897
0.0362043
0.00525892
-0.00632918
0.0338768
0.090191
0.00538893
2.53039
Log
VST Log
Images
Mean=2 Var=1e4
Random
0.0216665
0.0157734
0.0120125
0.038413
0.00551576
-0.00591928
0.0364027
0.089806
0.00673173
2.47986
Log
VST Log
Images
Mean=20 Var=1e5
Random
0.0251692
0.0193236
0.0124603
0.0538664
0.0056134
-0.0050991
0.0461941
0.118241
0.00874627
2.47881
Log
VST Log
Images
Mean=200 Var=1e6
Random
0.0494536
0.0387843
0.0211734
0.123058
0.00532042
-0.00254042
0.0950598
0.216287
0.0163558
2.48852
Log
VST Log
Images
Mean=2000 Var=1e7
Random
0.142333
0.112748
0.0641769
0.350723
0.00350408
0.00577988
0.26414
0.67883
0.0383639
2.5157
Log
VST Log
Images
Mean=20000 Var=1e8
Random
0.547571
0.441106
0.253666
1.23251
-0.0250702
0.0341783
1.01686
2.64395
0.176008
2.3684
Log
VST Log
Images


Example images follow:

rod_5_30_sym_random.0_0.0000.bmp

rod_5_30_sym_random.2_1e4.0000.bmp

rod_5_30_sym_random.20_1e5.0000.bmp

rod_5_30_sym_random.200_1e6.0000.bmp

rod_5_30_sym_random.2000_1e7.0000.bmp

rod_5_30_sym_random.20000_1e8.0000.bmp