
OSPF
Overview
This module gives students an opportunity to experiment with the OSPF routing protcol, observing how it updates it's neighbor table, and how it dynamically routes around downed links.
Setup Time: Varies
Tutorial Time: 30 minutes
Objectives
Upon completing this module you will:
- Be able to display OSPF information through a router command line interface.
- Be exposed to the general operation of the OSPF routing protocol.
- Be able to use the traceroute tool to view a route through a network.
Tutorial
A. Slice Creation and Instrumentation
This module assumes you are set up for and familiar with creating slices using the GENI Portal. Unlike some other modules it is not assumed that you already have a slice created, or resources allocated. Further, no instrumentation or GENI Desktop use is required for this module. This module, however, does assume you are familiar with the general concepts of the OSPF routing protocol.
B. Video
If you haven't already, watch the video above. It will walk you through the steps of the module.
C. Setup
1. Login to GENI Portal and click + New slice to create a new slice. Give it a name, perhaps <username>Ospf, then click Create slice.
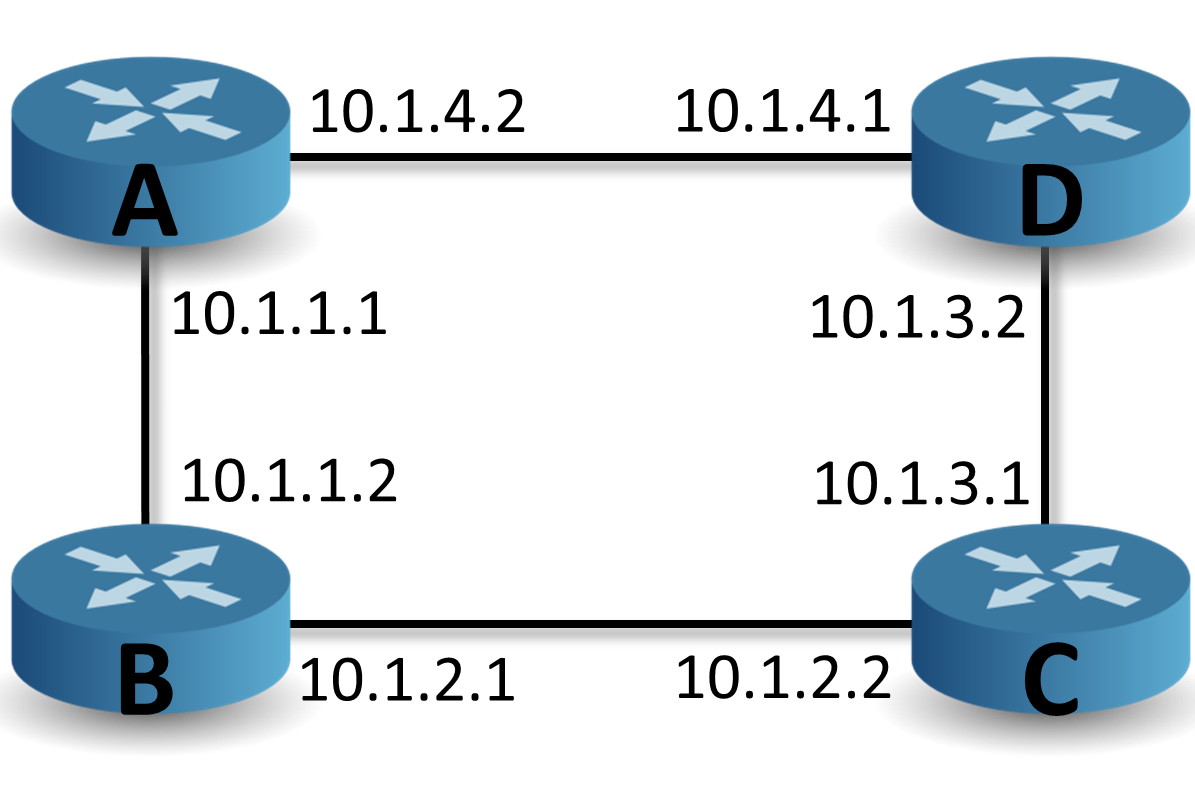
2. Click Add Resources. Create 4 nodes by dragging the VM icon to the screen, name them A, B, C, and D. Connect the nodes as picured below and set the IP addresses of each interface to match those of the below diagram. In each of the 4 nodes, under "Install Tarball", put the following in the URL field: "http://www.cs.unc.edu/Research/geni/geniEdu/rspecs/06-ospf-script.tar.gz" and in "Install Path" enter "/local". This downloads a gzipped tarfile from the given URL and installs it at the given path. We will need this file for the experiment. Click Site 1, and select any InstaGENI aggregate. Finally click Reserve Resources.
3. The Resource Specification (RSpec) lists the details about the resources and links we are requesting.
4. Make note of the login information once the resources have been assigned. After they are assigned, it may take several additional minutes for the resources to become ready to use. To determine when the resources are ready, click Ready? on the slice page, when the status changes from Unknown to READY, the nodes are ready to be used.
5. Open an SSH Terminal to each of the four nodes using one of the various methods. To avoid confusion we suggest that you arrange the terminal windows such that their positions match the network diagram above (ABCD counter clockwise starting in the upper left).
6. Open the setup script in an editor such as vim, nano, or emacs by typing, for example:
nano /local/06-ospf-script.sh
7. Scan through the contents, especially noting the comments, to get an general understanding of what the script is doing. The script basically installs and configures Quagga, which is an open source implementation of various routing protocols, including OSPF. The most complicated parts of the script involve copying and modifying quagga config files by appending (with ">>") or replacing (with "sed") certain content.
8. Type the following in the SSH Terminal for each node, to run the setup script:
/local/06-ospf-script.sh
9. The script should take about 2 minutes to run. Upon completion the script should report:
Starting Quagga daemons (prio:10): zebra ospfd.
10. Become root on each machine by typing:
sudo -i
D. OSPF Basics
OSPF stands for Open-Shortest-Path-First. It is currently the most widely used interior gateway protocol in the world. OSPF is a dynamic routing protocol which means it can automatically react to unexpected connectivity changes in the network.
Each OSPF router maintains a Link State Database (LSDB) containing Link State Advertisements (LSAs).
OSPF routers use Hello messages to discover their neighbors, and determine when links break. By default (and in our example network) OSPF routers send Hello packets every 10 seconds on point to point segments.
Newly discovered neighbors exchange their LSDBs with Database Description messages (DDs). OSPF routers then fill in the gaps in their databases using a three-way handshake consisting of a Link-State Request (LSR), Link-State Update (LSU), and finally a Link-State Acknowledgement (LSAck).
OSPF employs a configurable Router Dead Interval, which is the maximum time after which a "silent" router (one that hasn't sent a Hello) is declared "down".
OSPF uses Dijkstra's Shortest path algorithm to compute routes.
OSPF allows for hierarchical routing using areas, but to keep things simple, for this module all routers are configured in the same area (area zero).
E. Router Interface
1. Quagga provides an integrated user interface shell called vtysh, which connects to each of the underlying deamons (zebra and ospfd in our case). vtysh is a cisco-like command link interface (CLI). Many of the commands are similar to Cisco IOS (Internetwork Operating System) commands. With quagga installed, each of your nodes are functioning like routers, and in vtysh your shell will operate like a router configuration interface. Open the shell on each node by typing:
vtysh
Note, you must be root to execute this command (see step C-10 above).
2. Look at the OSPF neighbors for node A by typing the following in the vtysh console for node A(the prompt starting with "a.":
show ip ospf neighbor
You should see something similar to:
    Neighbor ID Pri State           Dead Time Address         Interface            RXmtL RqstL DBsmL
10.1.4.1          1 Full/DR           32.666s 10.1.4.1        eth1:10.1.4.2            0     0     0
10.1.2.1          1 Full/DR           30.335s 10.1.1.2        eth2:10.1.1.1            0     0     0
This shows that node A has found 2 neighbors, one with ID 10.1.4.1 (node D), and one with ID 10.1.2.1 (node B). The state column indicates the adjacency state. Full indicates that all the router and network LSAs have been exchanged and the routers' databases are fully synchronized.
DR indicates that this is the Designated Router, while Backup indicates this is the Backup Designated Router (BDR).
Dead Time shows the countdown of the Dead interval. It is reset to the dead interval each time a hello message is received.
The Interface column indicates which interface the neighbor is directly connected to.
3. Look at the routing table for node A by typing the following in the console:
show ip ospf route
This should produce output similar to:
============ OSPF network routing table ============
N    10.1.1.0/24           [10] area: 0.0.0.0
                           directly attached to eth2
N    10.1.2.0/24           [20] area: 0.0.0.0
                           via 10.1.1.2, eth2
N    10.1.3.0/24           [20] area: 0.0.0.0
                           via 10.1.4.1, eth1
N    10.1.4.0/24           [10] area: 0.0.0.0
                           directly attached to eth1

============ OSPF router routing table =============
This routing table shows that from the given node, to get to the networks indicated in the 2nd column a packet must be forwarded through the interface indicated in the third column, or forwarded to the directly attached interface indicated in the third column. It may help to look back at the network diagram to verify the values in the table. For example, to get from node A to the 10.1.2.0 network, a packet should be routed through 10.1.1.2 (B's interface to A). On the other hand, the 10.1.4.0 network is directly attached to a local ethernet interface (eth2 in this example). Packets destined for this network should be routed out that interface.
F. Dead Link
1. Exit out of the vtysh shell on node D's SSH Terminal by typing:
exit
2. Determine which interface is associated with IP address 10.1.4.1 by typing:
ifconfig
and finding the interface (i.e. eth1 or eth2) which lists 10.1.4.1 as its IP address.
3. Take down that interface using the following command:
ip link set dev <interface> down
where <interface> is replaced with the interface indentifier found in the previous step.
4. Quickly switch back to the vtysh shell on node A's SSH Terminal, and re-issue the following command to view the neighor table:
show ip ospf neighbor
5. Press up arrow, Enter, repeatedly to re-issue the command multiple times as you watch the Dead Time count down until the Neighbor is removed from the table. Notice that the other neighbor in the table begins to count down from 40, but gets reset to 40 when it receives a Hello message.
6. Back on node D's SSH Terminal. Bring the interface back up by typing:
ip link set dev <interface> up
7. On node A's SSH Terminal, and re-issue the following command:
show ip ospf neighbor
Notice the neighbor is back in the table. You may also be be able to watch the State of the newly added neighbor change from Init to Full. This is an example of how OSPF uses hello messages to update the neighbor table as network connections change over time.
G. Route Change
1. Traceroute is a tool for determining the route packets takes through the network form one node to another. On node A's SSH Terminal, trace the route from A to C's 10.1.3.1 interface by typing:
traceroute 10.1.3.1
Note, every once in a while traceroute will fail. If ever this happens, and it takes more than a few seconds to complete or you see "* * *", type Ctrl-c, and re-issue the command.
2. The output of the command should look similar to the following:
traceroute to 10.1.3.1 (10.1.3.1), 30 hops max, 60 byte packets
 1  D-DA_LAN (10.1.4.1)  0.765 ms  0.677 ms  0.655 ms
 2  C-CD_LAN (10.1.3.1)  0.631 ms  0.666 ms  0.646 ms
This shows that a packet leaving A and heading to C will travel first to 10.1.4.1 (on node D), and then to 10.1.3.1 (on node C). If it helps, you can just look at the first letter in the second column (D,C). This shows the route is going from A through D to C.
3. As done before, take down one of node D's interfaces. On node D's SSH Terminal take down the interface using the same following command:
ip link set dev <interface> down
4. Re-run the traceroute on node A's SSH Terminal by typing:
traceroute 10.1.3.1
5. The output of the command should look similar to the following:
traceroute to 10.1.3.1 (10.1.3.1), 30 hops max, 60 byte packets
 1  B-AB_LAN (10.1.1.2)  0.459 ms  0.447 ms  0.440 ms
 2  C-CD_LAN (10.1.3.1)  0.690 ms  0.671 ms  0.648 ms
Notice that packets are now being routed from A through B to C, since the route through D is now broken.
6. Back on node D's SSH Terminal. Bring the interface back up by typing:
ip link set dev <interface> up
6. Issue the traceroute command on Node A's SSH Terminal, multiple times, and notice that eventually the route reverts to the original route through node D.
Going Further - Assignment
1. From A ping one of C's interfaces. See if you can trick OSPF into failing to route packets momentarily (causing ping to hang) even though there is a path from A to C. Briefly describe how you did it?
2. The hello interval and dead interval values can be configured in the ospfd configuration located at /etc/quagga/ospfd.conf. Modify this file on each of the nodes, adding two lines below each interface like this:
 interface eth1
 ip ospf hello-interval 2
 ip ospf dead-interval 5
This changes the hello interval to 2 seconds, and the dead interval to 5 seconds. Change these values on each of the 4 nodes, and then restart quagga by typing the following on each node:
sudo /etc/init.d/quagga restart
Finally enter the router interface again by typing
vtysh
Redo sections F and G above, then answer the following questions:
A. From your experience in the main part of the module, before you made changes, what is the default value of the dead-interval for this implementation of OSPF?
B. After making the above changes, what is different in how OSPF responds to broken links?
C. What types of networks would shorter hello-interval and dead-interval values be more suited for?
D. What is one downside of using shorter hello-intervals and dead-intervals?
Shutdown
Upon completion of the module please delete your slice's resources as described in the Shutdown module.