These are results from GENI-Tmix experiments run on two
ProtoGENI nodes for one hour each with Iperf flows.
These experiments
consisted of 1 Iperf flow (or 10 Iperf flows) starting at time t=0, and then
the GENI-Tmix emulation was started at time t=10min. That emulation consisted
of 156,131 TCP connections, each connection emulating the minimum Round Trip
Time (RTT) that was measured in the original production link.
Time
Series of Throughput in the two directions for the two hour long experiments
One
Iperf flow starts at time t=0, the Tmix
emulation starts at time t=10min; compare this to the Tmix-only
emulation below
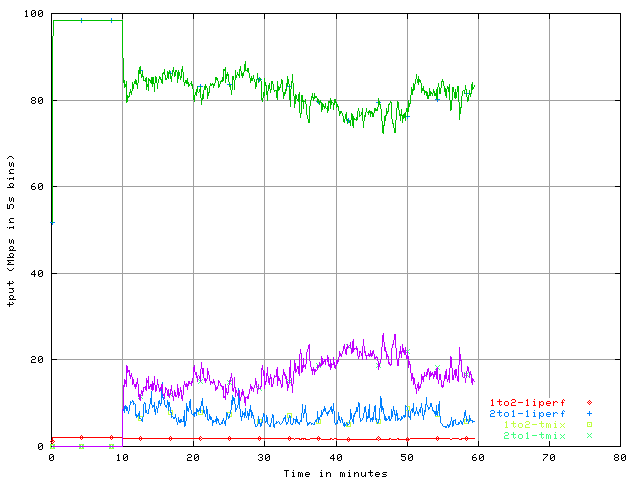
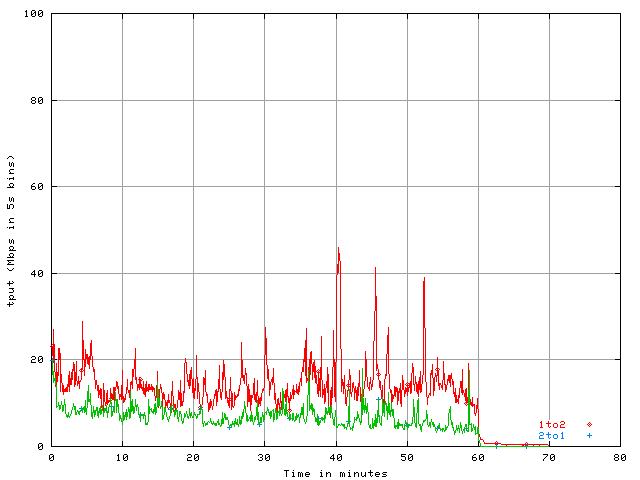
Tmix aggregate - Average
throughput: 14Mbps and 6Mbps; compare this with the Tmix aggregate with no Iperf - Average throughput: 15Mbps and 7Mbps
Iperf flow - Average
throughput: 84Mbps and 2Mbps
The time series of throughput in Mbps
is shown in both directions for the single Iperf flow as well as the aggregated
Tmix emulation.
Note how the single Iperf flow has affected the TCP
connections in the Tmix emulation and vice versa.
Time
Series of Throughput in the two directions shown for the 10 Iperf flows as well
as the aggregated throughput for Tmix emulation
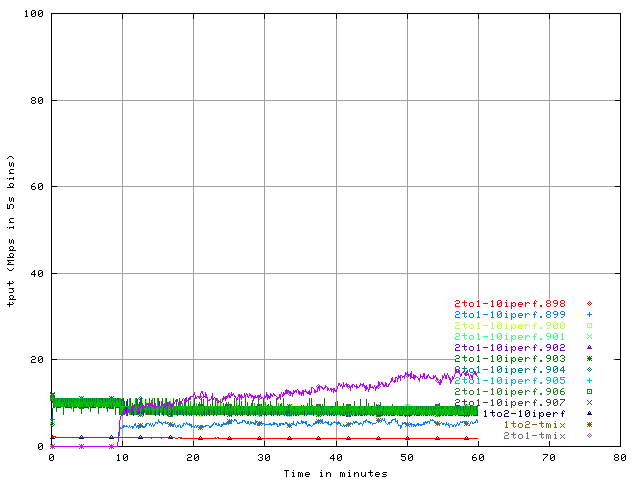
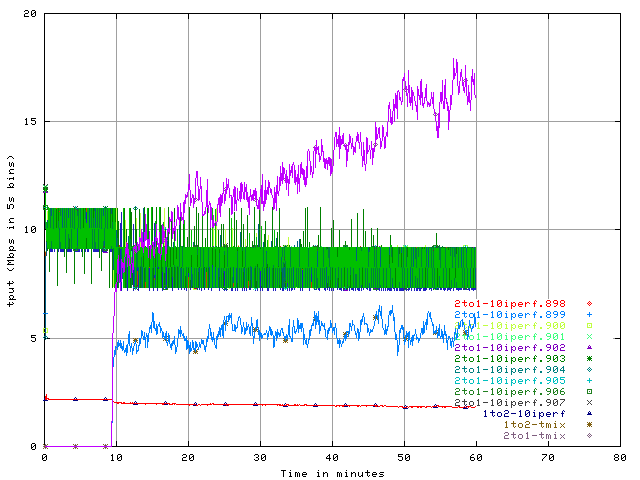
Tmix aggregate - Average
throughput: 11Mbps and 4.5Mbps
Iperf flow - Average
throughput: each of the 10 Iperf flows averaged ~ 8.8 Mbps in the above
experiment
2Mbps for all 10 Iperf flows in dir-1to2
Note: The ten Iperf flows start at the
same time t=0, the Tmix emulation starts at time t=10min
The time series of throughput in Mbps
is shown in both directions for the 10 Iperf flows separately (identifying them
by port) as well as the aggregated Tmix emulation.