These are results from a GENI-Tmix
experiment run on two ProtoGENI nodes for one hour.
We ran several such experiments; this is one sample.
The experiment
consisted of 156,131 TCP connections, each connection emulating the minimum
Round Trip Time (RTT) that was measured in the original production link.
Throughput
in the two directions (different scales)
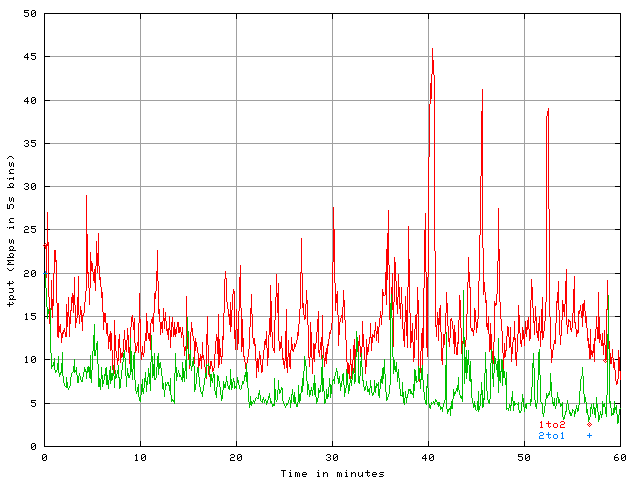
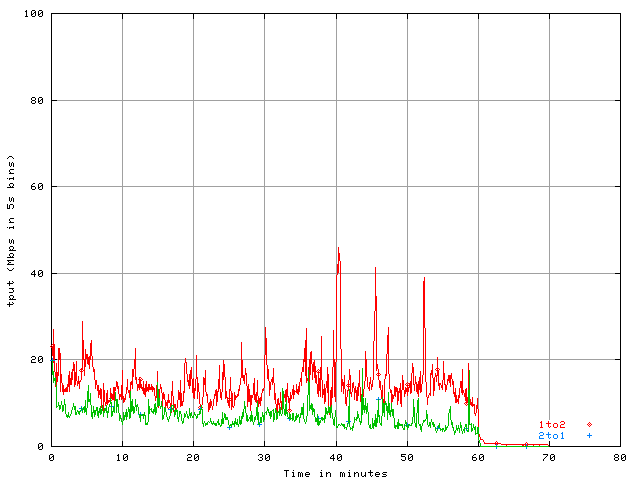
Average
throughput: 15Mbps (1to2) and 7Mbps (2to1)
CDF
(Cumulative Distribution Function) and CCDF (Complementary CDF) - Comparing
RTTs measured during the experiment vs. original RTTs
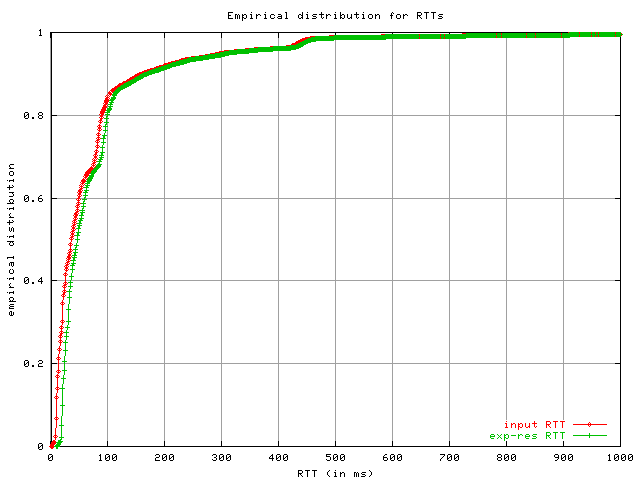
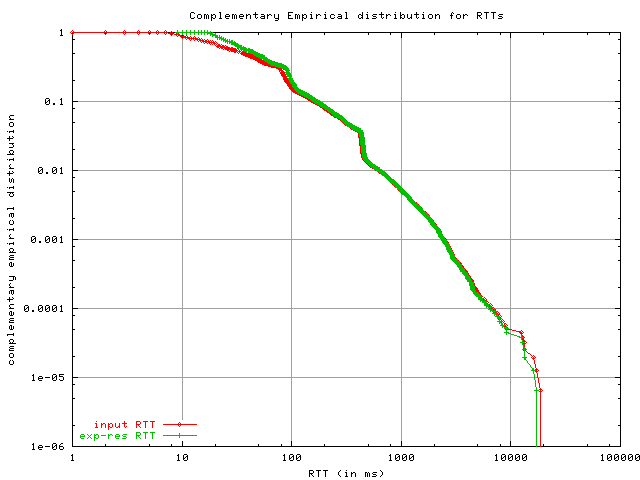
RTTs measured during the experiment: mean RTT = 91 ms; median RTT = 47 ms; 10% of
RTTs > 169 ms; 1% of RTTs were greater than 634 ms
CDF
(Cumulative Distribution Function) and CCDF (Complementary CDF) - Comparing
Request sizes within TCP connections
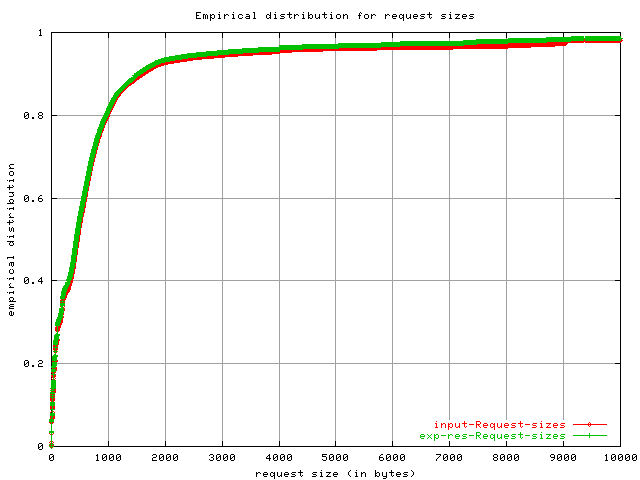
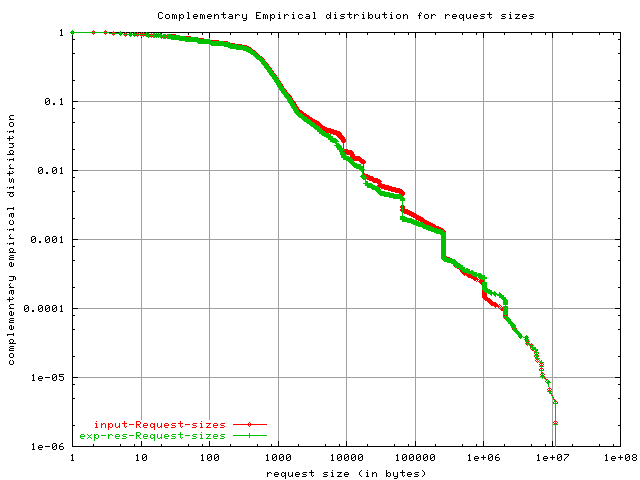
Request sizes measured during the experiment: mean request
= 2.2KB; median request = 437 Bytes; 10% of requests were greater than 1.5KB
CDF
(Cumulative Distribution Function) and CCDF (Complementary CDF) - Comparing
Request sizes within TCP connections
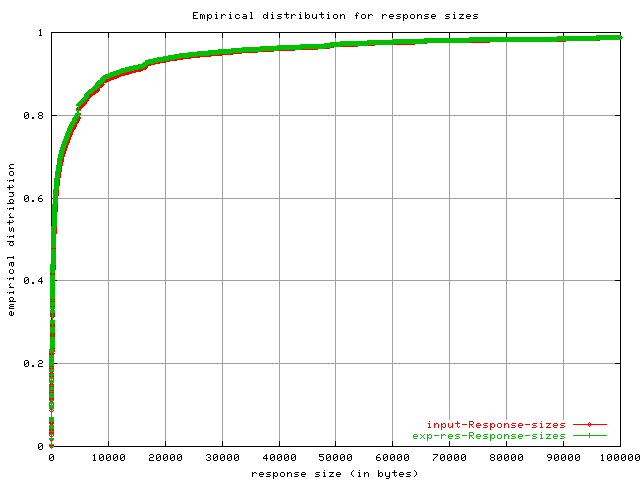
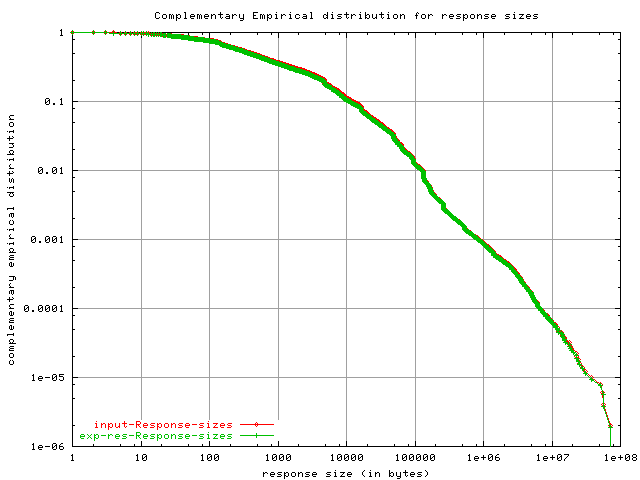
Response sizes measured during the experiment: mean response
= 10 KB; median response = 370 Bytes; 30% of responses were greater than 1.5KB;
20% of responses were greater than 4.5KB; 10% of responses were greater than 11
KB;
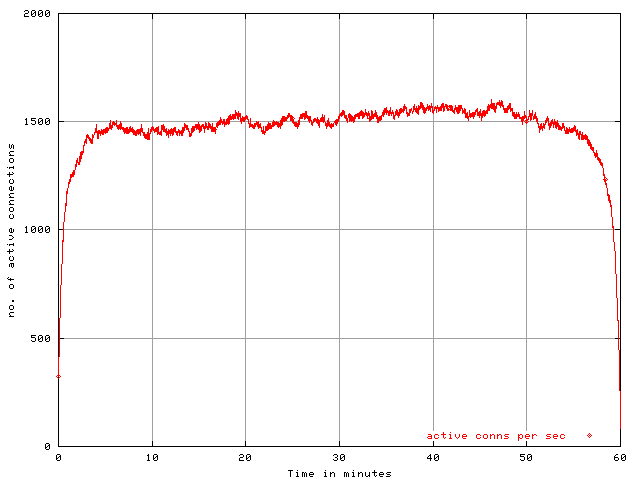
Time
Series of the number of Active Connections per second during the experiment
CDF (Cumulative
Distribution Function) and CCDF (Complementary CDF) – Duration of the TCP
connections
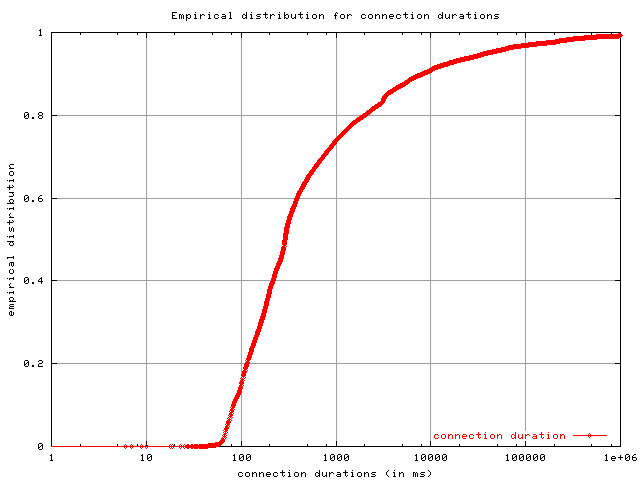
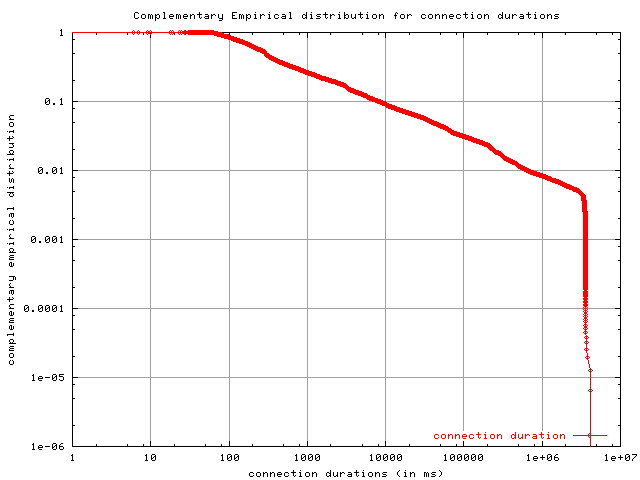
Connection Durations measured during the experiment: mean
duration = 33 sec; median duration = 290 ms; 20% of connections
last greater than 2 seconds; 10% of connection durations were greater than 8.2
seconds; 2% of connection durations were greater than 4 minutes; 1% last
greater than 10 minutes; note that 1% of connections is greater than 1500
connections, which would explain the number of active connections per second above.