This course describes the current state of the art in computer-based visualization as applied in the natural and medical sciences. It includes teaching the available visualization techniques and their characteristics (including enough description of perception to enable understanding why some techniques work and others do not). It is aimed both at computer science students (who would design and implement such visualizations) and at natural science students (who would design and use them). It includes teaching each student how to use an available visualization toolkit to enable rapid development of visualizations. A final project teams students to develop a visualization tuned for a particular problem, either using a toolkit or custom code.
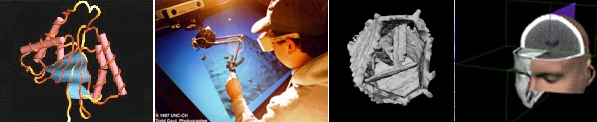
The value of visualization (what are the likely benefits, example applications). Visualization toolkits (what is available, how easy are they to use, what techniques they provide, how do you get your data into them). Scalar-field visualization in 2D (color, height field, isovalue contours, glyphs, clustering, patterns) and 3D (isosurface contours, direct volume rendering, slicing, glyphs). Vector-field and Tensor visualization techniques in 2D and 3D (particle advection, streamlines, streaklines, rakes, tufts, line-integral convolution, spot noise). Multivariate visualization (discrete data, glyphs, textures, dimensional reduction). Advanced and combined visualization techniques (which combine, which don't, how can you predict?). Other methods (animation, haptic display of data, auditory display of data). Basics of human visual perception (what impacts region perception, shape perception, color perception, etc). Tying analysis into visualization. Evaluating the effectiveness of visualization.
The course will include lectures on the above topics, weekly "hands-on" homework application of visualization techniques to data sets from a variety of scientific fields, and a final project. The hands-on application will give participants a feeling for how each technique works in a variety of settings. The project will team students to develop a new visualization technique beyond what comes standard in toolkits. The level of these projects are such that the most successful ones are suitable to be written up as application papers for the IEEE Visualization conference.
This course is aimed at graduate students and senior undergraduates in both computer science and the natural sciences. There are no prerequisites other than being a graduate student in a natural sciecen (examples: Biology, Chemistry, Physics, Materials Science, Gene Therapy) or Computer Science. Computer science students will benefit from experience in computer graphics and image analysis. Natural science students will benefit from having a data set they are interested in visualizing.
Information Visualization: Perception for Design, third edition, by Colin Ware, published in 2012 by Morgan Kaufmann. ISBN-13: 978-0123814647. The UNC Student Stores has this in stock. If they run out, you can also get this book from Amazon.com our your favorite vendor. Unfortunately, the first and second editions won't suffice -- they don't have the numbered guidelines required for homeworks that the third version has.
Visual Cues: Practical Data Visualization, by Peter R. Keller and Mary M. Keller, published in 1992 by IEEE Computer Society Press. ISBN 0-8186-3102-3. This book has gone out of print; there is a class set available for students taking the class. They are on reserve in Sitterson 208, the reading room overlooking the bus stop. They are to the right as you come in, at about knee level, on the East wall right behind the pillar (sometimes there is a chair pushed back against this bookshelf that hides them).
Several downloadable documents from Kitware that describe the visualization software to be used in the course. In the past, this has been VTK: currently, Paraview and VolView will be used as part of teaching the use of a visualization toolkit. You may want to get the VolView user's guide; the ParaView guide is included in the installer. Here is a description of how to get Paraview and VolView.
Other useful (not required) texts: The three wonderful books by Edward R. Tufte are also on reserve in the reading room.
The course is being taught by Russell Taylor.
Office hours: Mondays 10-11, Thursdays 9-10, Sitterson 258. We can schedule meetings at other times as needed; send email to the instructor.
See the course schedule for the reading assignments and lecture topics. Online and printable version of the lectures for that course wil be available from links off the schedule page. The homeworks are also listed on the schedule page. See the email on the mailing list for a pointer to the list of potential projects for this semester. See the final project page for a description of what the final project entails. See the syllabus for further information.
Email list: Be sure to subscribe to the email list for this course. You subscribe by sending email to the instructor, and you send mail to the list at comp715@cs.unc.edu. It is moderated, so only Russ gets to see the SPAM.
Homework page: See http://images.cs.unc.edu/comp715_2014 to upload your homework assignments and to comment on the others. This is a repository that is visible to everyone in the class (protected by a password we will all know). It will include your homework submissions, comments by other students on your submisions, and comments from me on your submissions. Some of these (winners, those that have particular benefits, those that make good examples, etc.) will be distributed in poster form, and on various visualization web pages (at Kitware, at Sandia National Labs, on MADAI.us) as examples for others to follow; the techniques they show may also be implemented in ParaView or VTK or other tools and made broadly available.
Potential Projects: I'm collecting these.
Lawrence Livermore National Laboratories. Los Alamos National Laboratories. Lawrence Berkeley National Laboratories. NASA Ames. Visual complexity (infovis). NAS list of visualization sites. There is a set of links to scientific visualization sites. Derek Merck found a Gallery of Data Visualization web page by with Tuftian-like commentary on the visual presentation of information. The Masters in Health Administration program at Ohio University has a health brain games and optical illusions page. There is a collection of information graphics at visual.ly. There is a description of visualization techniques here. Journal of Physics special issue on Visualization in Physics. There is a Meet the Scientists page at UCDavis that shows four different supercomputer simulation visualizations. The Beastiario project reMap has a large number of different infovis displays. There is a visual bibiography of tree visualization by Hans-Jorg Schulz. There is an online list of selected information visualization tools here.
Maragaret Livingstone gave the keynote lecture at the Visweek 2008 conference on "What Art Can Tell Us About the Brain", mixing psychology, art, and visualization into a compelling narrative full of visual illusions and examples from art. It is available online for free.
Bill Lorenson uploaded a large amount of volume data to the National Library of Medicine Midas repository: http://placid.nlm.nih.gov/community/21
The Visualization Toolkit (VTK), including the ParaView and Volview visualization programs. The VisTrails system (uses VTK) from the University of Utah. Advanced Visual Systems (AVS) home page. Also, the International AVS Centre, which has tutorials and downloadable AVS modules as well as other information. The VisIt system (uses VTK) from LLNL for parallel interactive visualization. Bill Hibbard's VisAD and Vis5D packages. OpenDX (data explorer) home page. Iris Explorer, which is now marketed by NAG. The NIH Image (image-analysis software for the mac) home page. There is a system called Ensight that specializes in flow and volume/isosurface display. The Visualization and Analysis Platform for Oceanic, Atmosphere, and Solar Researchers (VAPOR) integrates with IDL and support WRF datasets. OpenView is an Information Visualization application from Kitware (in alpha as of 1/10/2013). There is an online javascript library for infovis (D3) online. GGobi is an infovis tool for visualization of high-dimensional scatter plots, including animated tours of N-space. Nodebox is an open-source set of tools for infovis.
See the lecture on toolkits for pointers to others.
Kent Eschenberg has a Paraview tutorial online at the Pittsburgh Supercomputing Center.
An Information Visualization MOOC was taught in 2013 and 2014 at Indiana University.
A portion of this course was taught at SIGGRAPH 2003 by Russ Taylor, Colin Ware, and Victoria Interrante as course #45, "Perceptually Based Visualization Design."
The ACM SIGGRAPH Education for Visualization Committee produced a draft report on a curriculum for visualization education.
UNC Information and Library Science INLS 110-99, "Selected Topics: Information Visualization," taught by Rolf Daessler (visiting from Potsdam, Germany) in the summer of 2001.
University of New Hampshire OE/CS 867:767 Interactive Data Visualization, taught by Colin Ware
Stanford University CS448B Visualization, taught by Pat Hanrahan
Utah CS5630, "Scientific Visualization," taught by Chris Johnson in the spring of 2002.
University of Maryland Baltimore County CSMC491B/691B, "Visualization Techniques," taught by David Ebert and Penny Rheingans in the autumn of 1999.
University of New Hampshire OE/CS 867:767, "Interactive Data Visualization," taught by Colin Ware.
Virginia Tech ESM4714, "Scientific Visual Analysis with Multimedia," taught by Ron Kriz in the spring of 2000.
FSU CIS4930/5930, "Visualization," taught by David Banks in 2000.
RIT CSC 472/672, "Data Visualization," taught by G. Scott Owen in the fall of 1996.
CS 237, "Interdisciplinary Scientific Visualization," taught by David Laidlaw and Daniel Acevedo in the fall of 2003 and in prior years by David Laidlaw, is a project-based course that teams computer scientists with domain scientists to "fund," design, implement, and evaluate a project in scientific visualization.
There is an online Information Visualization course offered by Katy Borner from Indiana University.
One of these is Donald Hoffman's illusion page. There is another, Japanese, page with an incredible moving illusion at the top at http://www.ritsumei.ac.jp/~akitaoka/saishin-e.html.
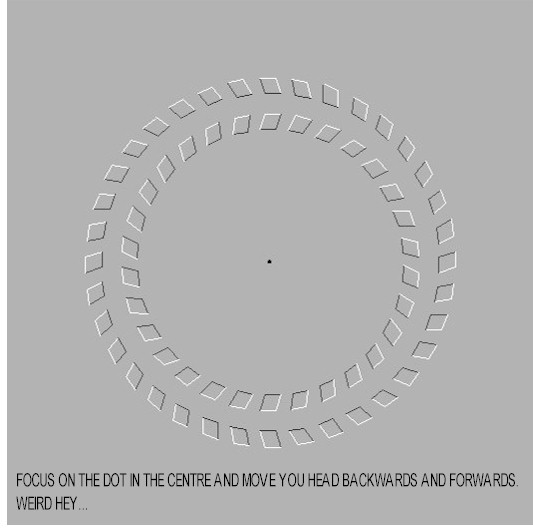
The following one from Arthur Shapiro is even more strange. By rotating the ellipses you can change their apparent motion from rocking to wobbling back and forth. If you clear the background, the effect disappears!