Mice and Elephants Visualization of Internet Traffic
by
J. S. Marron,
F. Hernández-Campos,
and
F. D. Smith
The plots shown here are an expanded set of results for the following paper:
J. S. Marron, F. Hernández-Campos, and F. D. Smith, Mice and Elephants Visualization of Network Traffic.(PostScript Version)
(PDF Version)
The data for these plots are extracted from empirical datasets obtained by tracing TCP/IP packet headers. These traces were created by recording the TCP/IP header of each packet flowing on the network link connecting the UNC Chapel Hill campus to the Internet over 4-hour intervals. A timestamp (with microsecond resolution) was also recorded for each header along with the length in bytes of the packet. Two traces were used for this paper; one taken on a Thursday afternoon (a heavy traffic period) and one taken on a Sunday morning (a light traffic period). Both traces are from the same week in April, 2001. Additional details on the data collection and processing methods can be found in:
F.D. Smith, F. Hernández-Campos, K. Jeffay, and D. Ott, What TCP/IP Protocol Headers Can Tell Us About the Web, Proceedings of
ACM SIGMETRICS 2001/Performance 2001, Cambridge, MA, June 2001, pages 245-256.
(PDF Version)
The data shown in the plots represent the network transfer times for fetching web objects (HTML pages, embedded images, etc.) by browsers (Netscape or Internet Explorer) used on the UNC-Chapel Hill campus. The transfer time for an object is represented as a horizontal line segment where the left endpoint is plotted at the (relative) timestamp of the first packet containing data for the object and the right endpoint is at the timestamp of the last packet. Thus, the line segment represents the time period that network packets are flowing for a single object. Since many such flows share the link concurrently, their line segments overlap in time. For convenient visual separation of the flows, a random height is added to the line segment for a given flow.
The interesting feature of these flows is the presence of a very large number of short (< 1 second) flows but also a few very long flows (> 1 hour). The terminology "mice" (short) and "elephants" (long) for flow durations provides a nice metaphor for web traffic. There are relatively few elephants and a large number of mice.
There are two types of visualizations shown here. The first type emphasizes the sampling effects in the "mice" and "elephant" flows by looking at different durations of time in the traces (zooming-in on the time scale). The "zoomed-in views" show these effects in going from a view over the full four-hour duration to shorter durations down to around 14 seconds. Each successive interval is obtained by taking the middle 25% of the previous interval (marked by vertical green lines). This is equivalent to zooming-in by a factor of 4 centered at the midpoint of the previous interval. In each interval a random sample of 5000 flows active in the interval is selected for plotting to illustrate sampling issues (and to avoid obscuring from overplotting)
The second type of visualization is obtained by plotting over the entire four-hour interval but showing only the N longest-duration flows for N = (5000, 2000, 1000, 500, 200, 100). These views, the "elephants-only views," emphasize the relatively few flows with very long durations.
The fundamental property of web flow durations is that their distribution is very "heavy-tailed," in this case a mix of Pareto distributions. The significant effects from this property are illustrated by creating two synthetic traces based on the original empirical traces. In the synthetic trace, each flow start time is the same as in the orignial trace but the flow duration (ending time) is synthetically generated by random sampling from an exponential distribution with the same mean as computed from the trace data. Synthetic versions of both the Thursday afternoon and Sunday morning traces were created and are shown as "zoomed-in views" and "elephants-only views." The visualizations of the synthetic traces with "light-tailed" exponential durations can be compared with those from the original traces with heavy-tailed durations.
The visualizations are organized in groups ordered to match the order of presentation in the original paper. Each group label below is a link to where that group can be found in this page.
The following images can also be found in this .pdf file.

Figure 1. Mice & Elephants over four hour trace (sample of 5,000 flows out of 6,870,022 active in this interval).
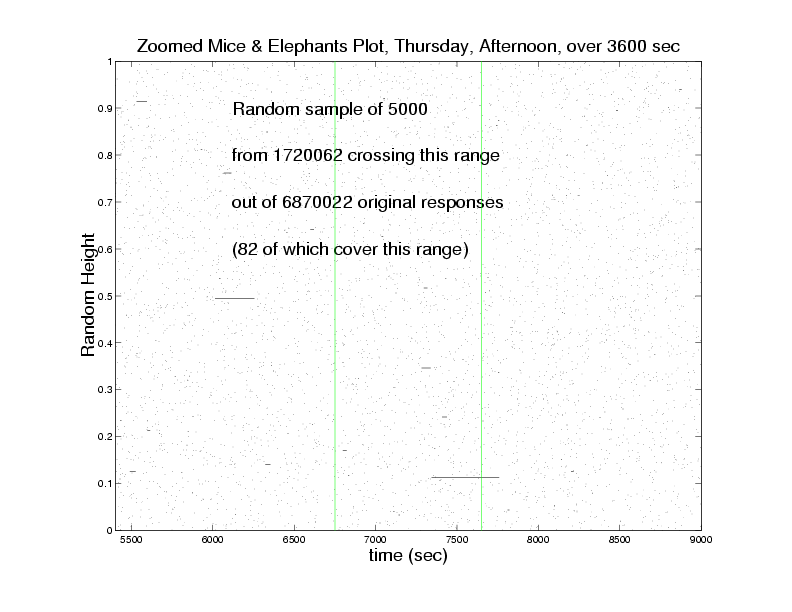
Figure 2. Mice & Elephants over middle 1 hour interval (sample of 5,000 flows out of 1,720,062 active in this interval).

Figure 3. Mice & Elephants over middle 15 minute interval (sample of 5,000 flows out of 414,982 active in this interval).

Figure 4. Mice & Elephants over middle 3.75 minute interval (sample of 5,000 flows out of 104,839 active in this interval).
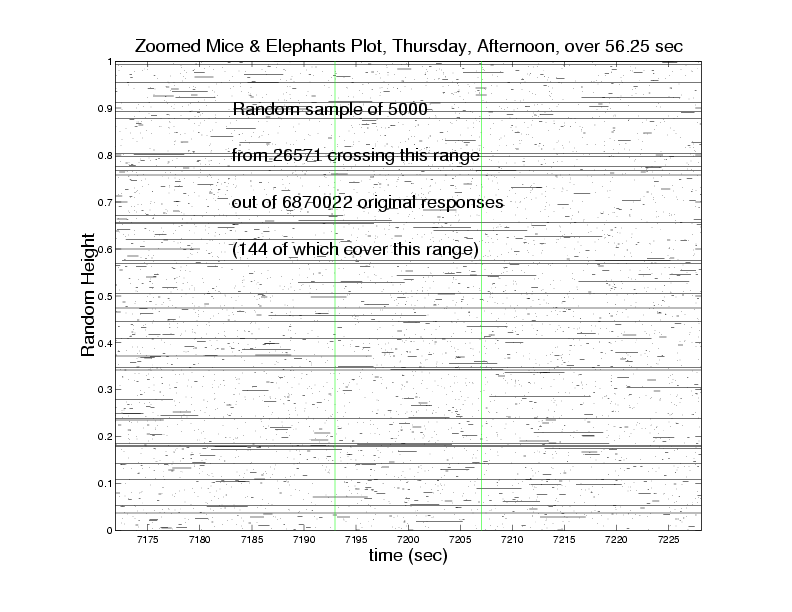
Figure 5. Mice & Elephants over middle 56.25 second interval (sample of 5,000 flows out of 26,571 active in this interval).
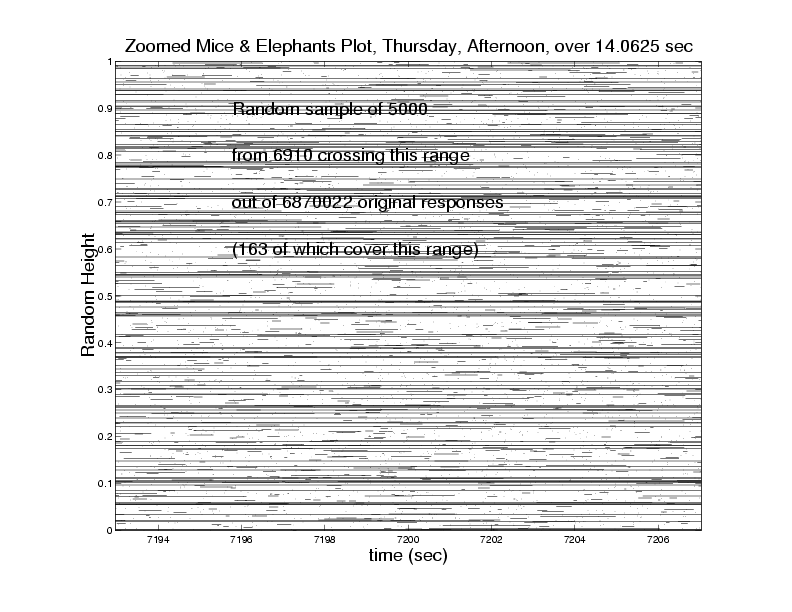
Figure 6. Mice & Elephants over middle 14.063 second interval (sample of 5,000 flows out of 6,910 active in this interval).
The following images can also be found in this .pdf file.
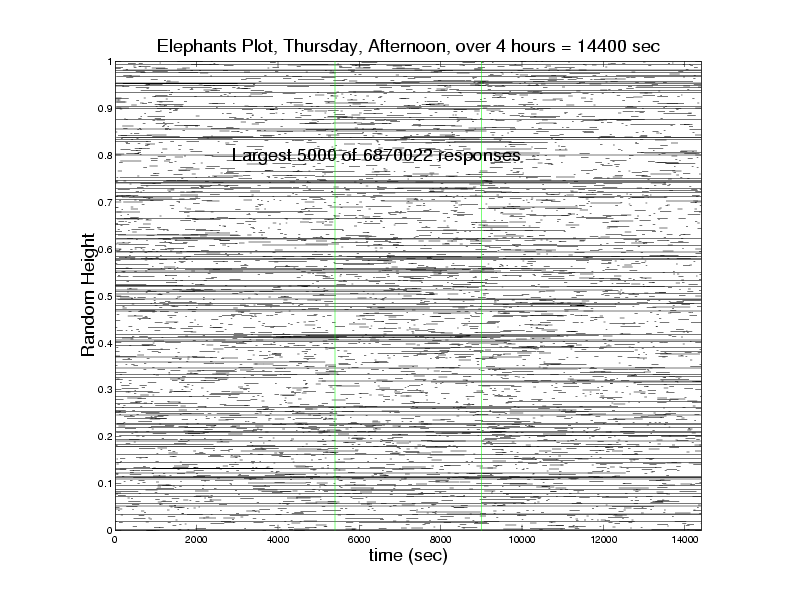
Figure 7. Elephants over four hour trace (5,000 longest flows out of 6,870,022 active in this interval).
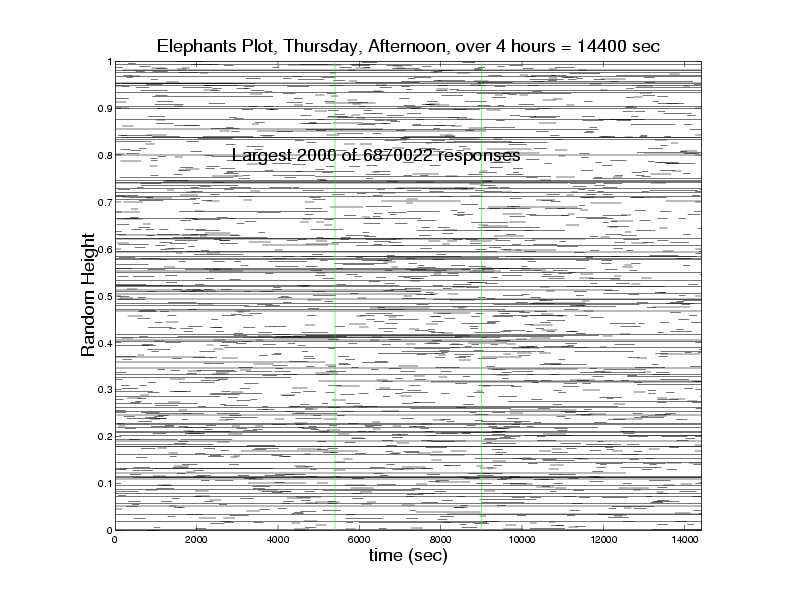
Figure 8. Elephants over four hour trace (2,000 longest flows out of 6,870,022 active in this interval).
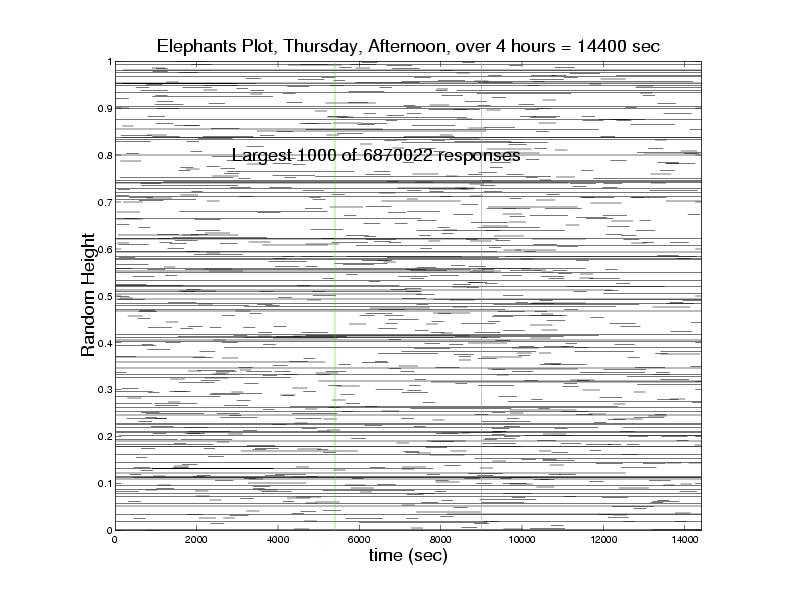
Figure 9. Elephants over four hour trace (1,000 longest flows out of 6,870,022 active in this interval).
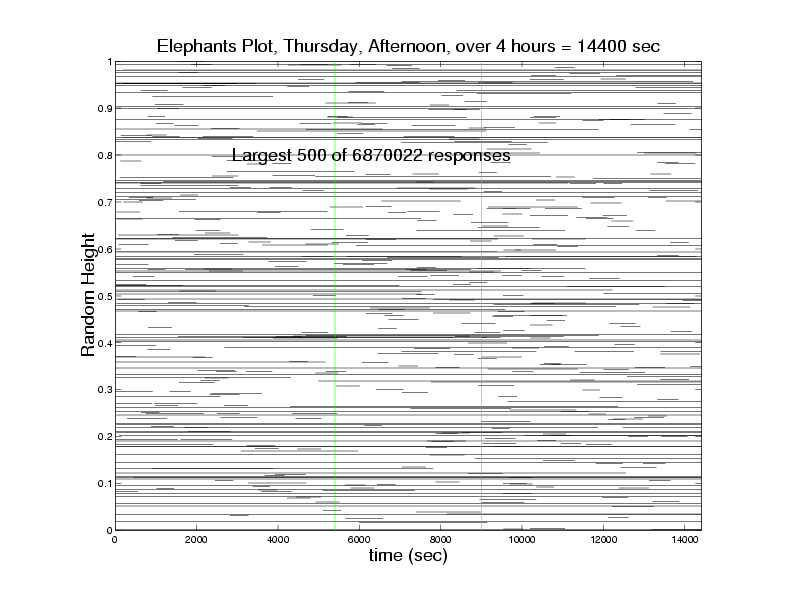
Figure 10. Elephants over four hour trace (500 longest flows out of 6,870,022 active in this interval).
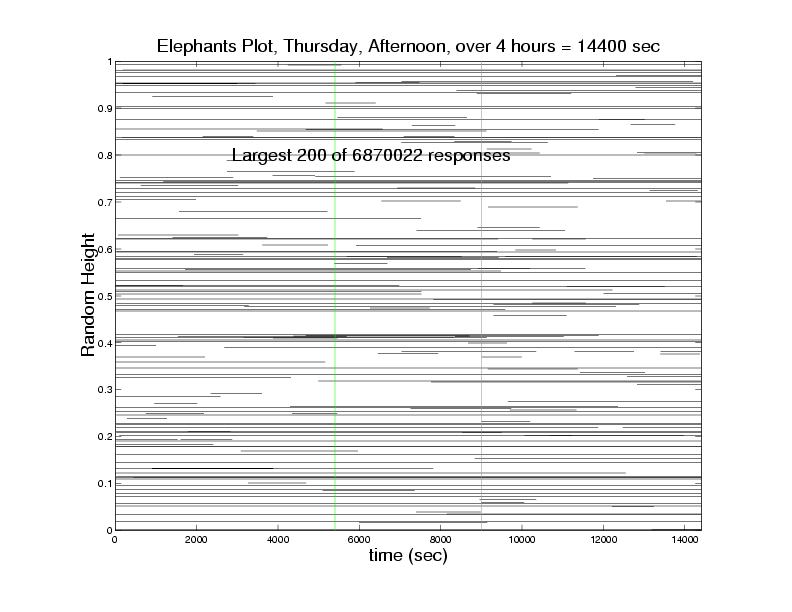
Figure 11. Elephants over four hour trace (200 longest flows out of 6,870,022 active in this interval).
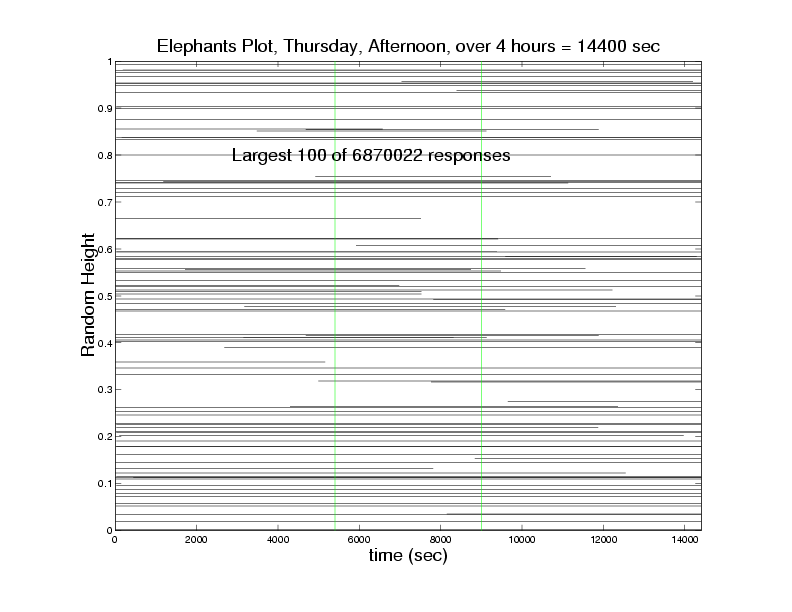
Figure 12. Elephants over four hour trace (100 longest flows out of 6,870,022 active in this interval).
The following images can also be found in this .pdf file.
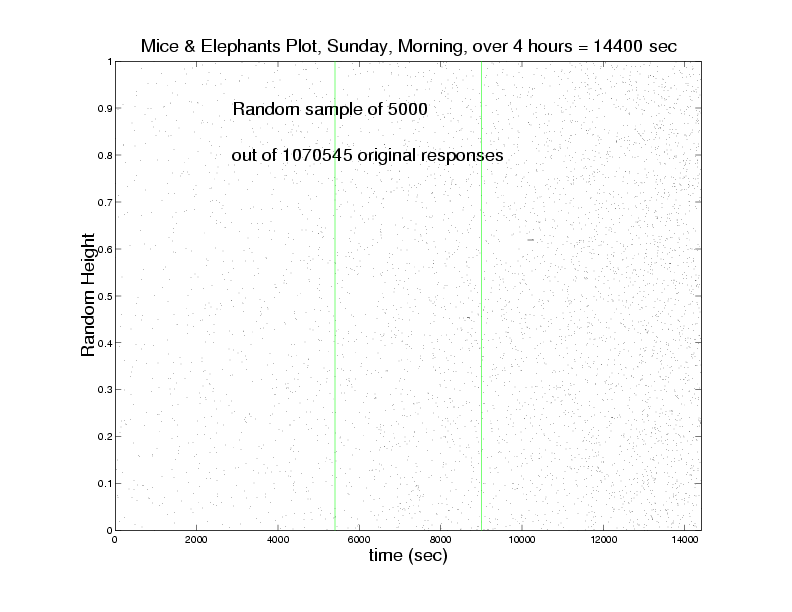
Figure 13. Mice & Elephants over four hour trace (sample of 5,000 flows out of 1,070,545 active in this interval).
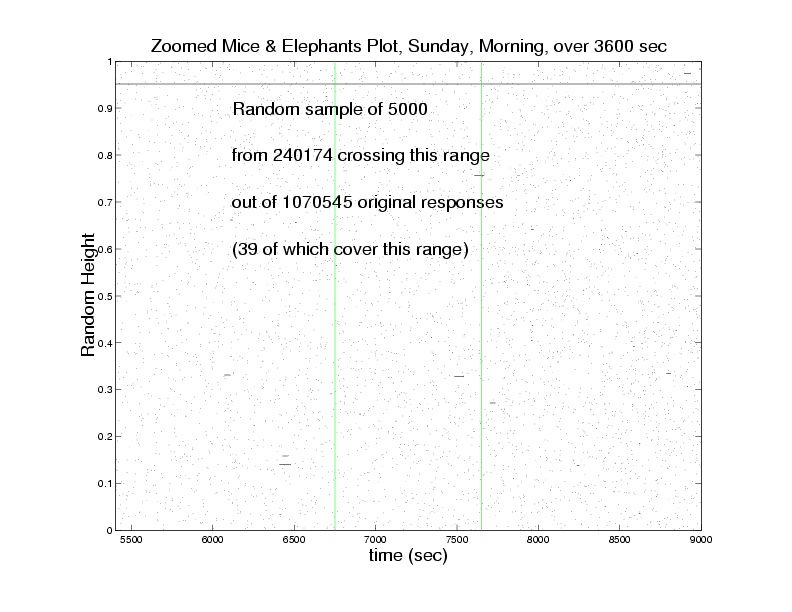
Figure 14. Mice & Elephants over middle 1 hour interval (sample of 5,000 flows out of 240,174 active in this interval).

Figure 15. Mice & Elephants over middle 15 minute interval (sample of 5,000 flows out of 59,113 active in this interval).
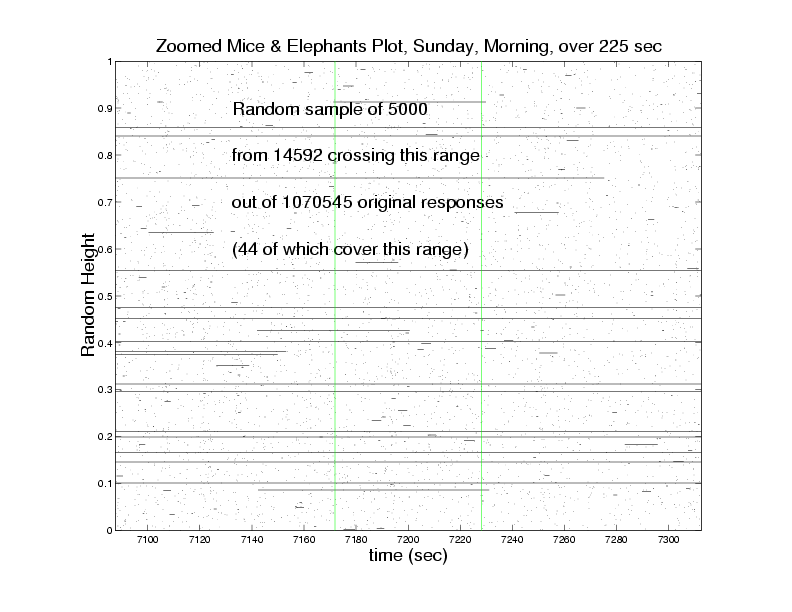
Figure 16. Mice & Elephants over middle 3.75 minute interval (sample of 5,000 flows out of 14,592 active in this interval).
The following images can also be found in this .pdf file.
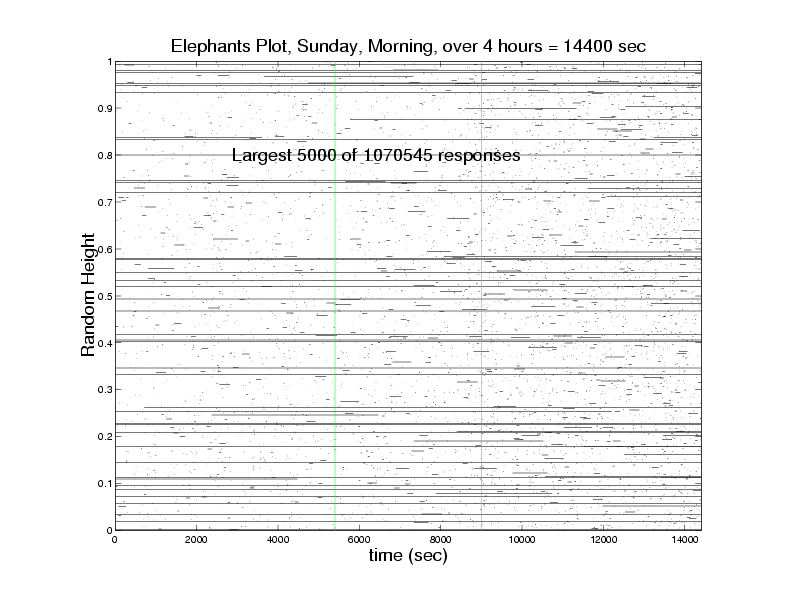
Figure 17. Elephants over four hour trace (5,000 longest flows out of 1,070,545 active in this interval).
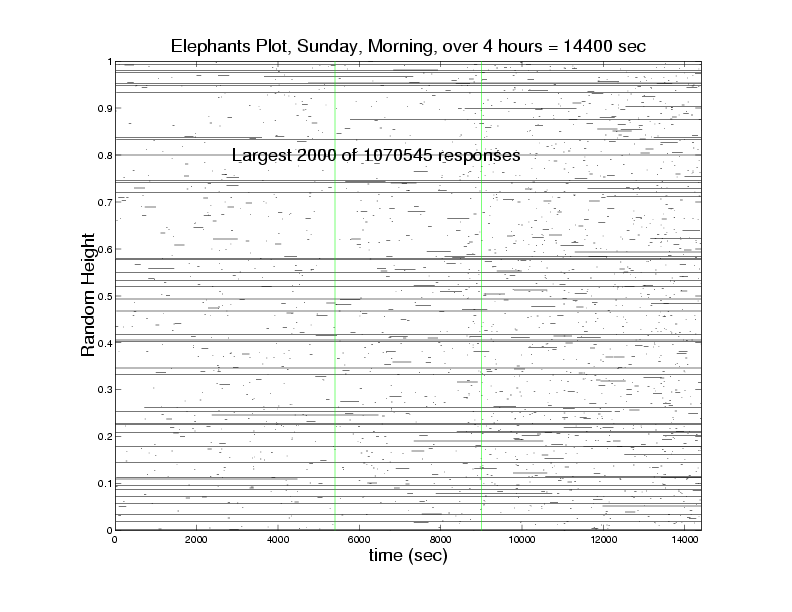
Figure 18. Elephants over four hour trace (2,000 longest flows out of 1,070,545 active in this interval).
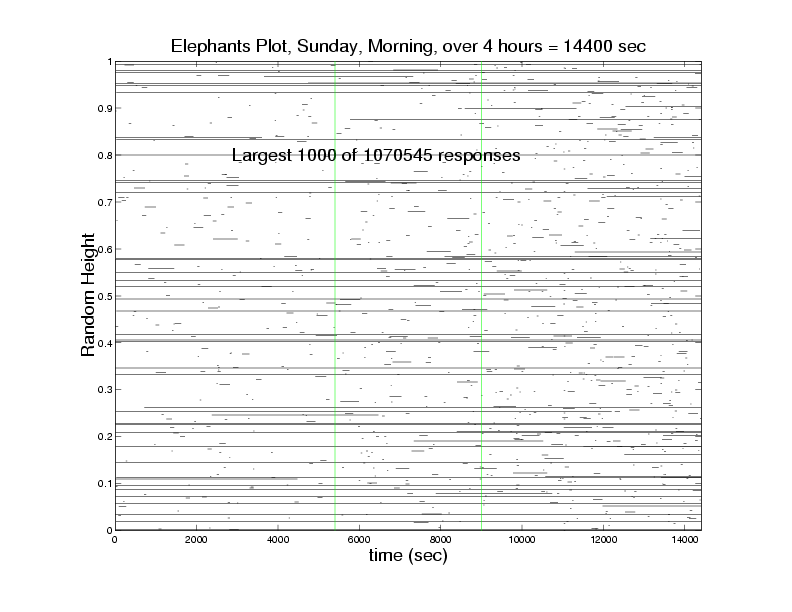
Figure 19. Elephants over four hour trace (1,000 longest flows out of 1,070,545 active in this interval).

Figure 20. Elephants over four hour trace (500 longest flows out of 1,070,545 active in this interval).

Figure 21. Elephants over four hour trace (200 longest flows out of 1,070,545 active in this interval).

Figure 22. Elephants over four hour trace (100 longest flows out of 1,070,545 active in this interval).
The following images can also be found in this .pdf file.
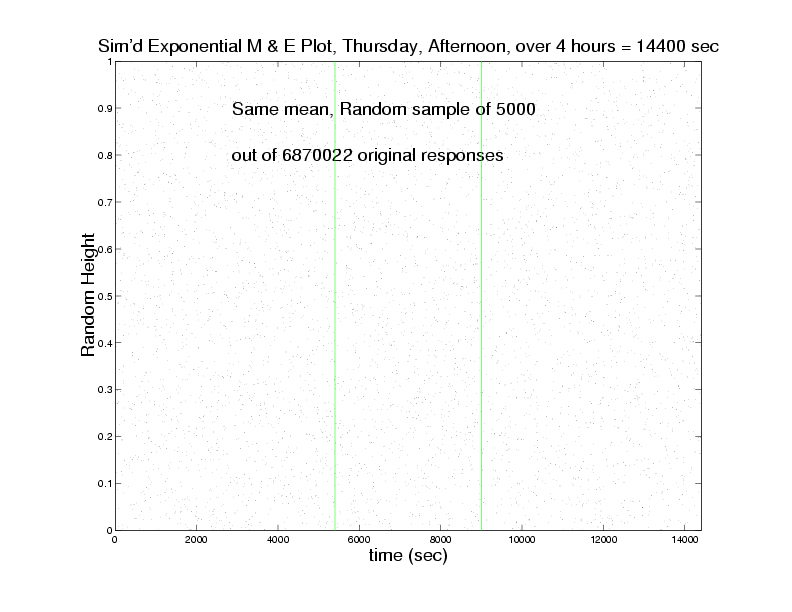
Figure 23. Mice & Elephants over four hour synthetic trace (sample of 5,000 flows out of 6,870,022 active in this interval).
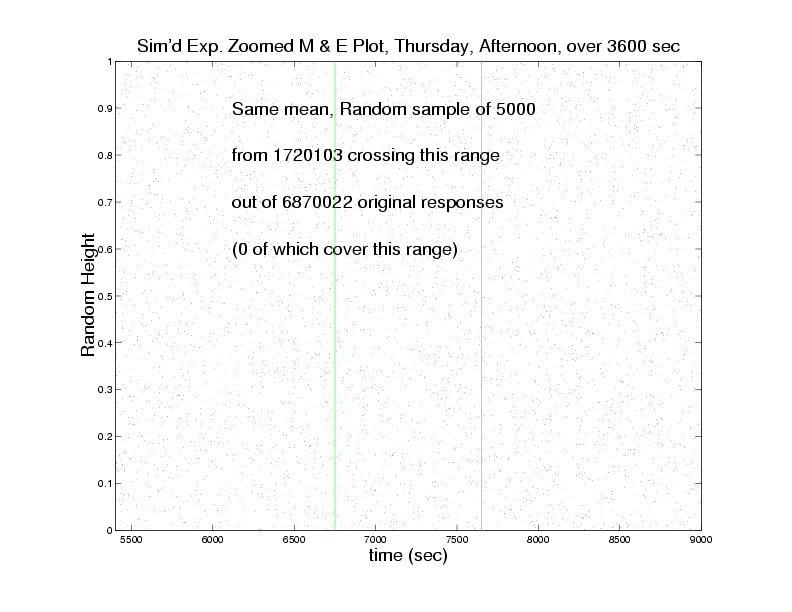
Figure 24. Mice & Elephants over middle 1 hour interval (sample of 5,000 flows out of 1,720,103 active in this interval).
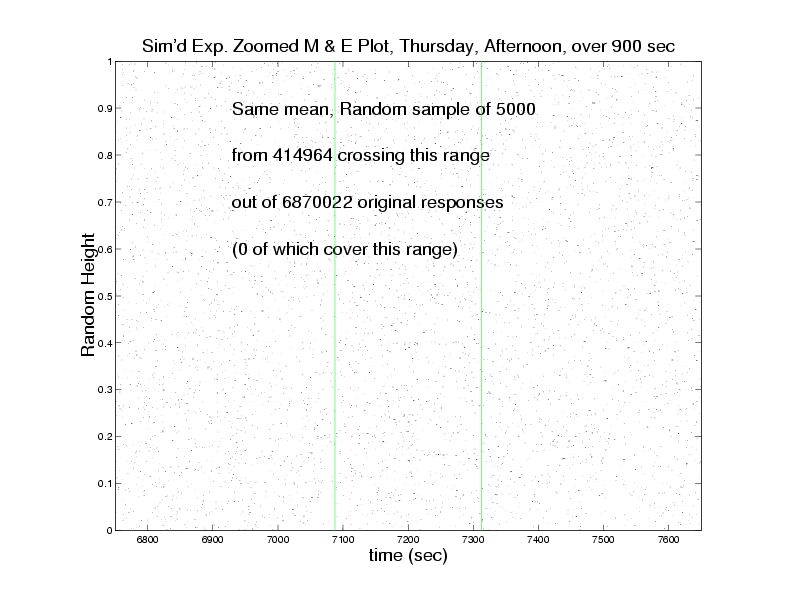
Figure 25. Mice & Elephants over middle 15 minute interval (sample of 5,000 flows out of 414,964 active in this interval).
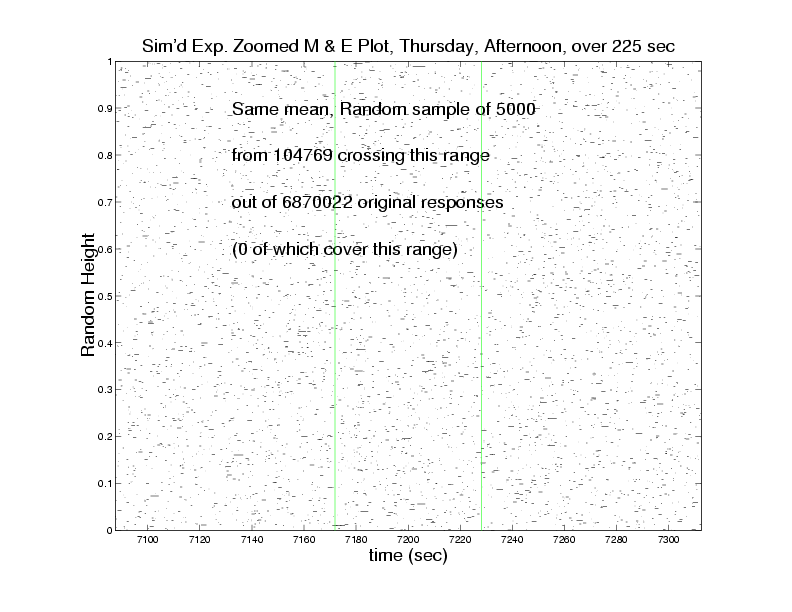
Figure 26. Mice & Elephants over middle 3.75 minute interval (sample of 5,000 flows out of 104,769 active in this interval).
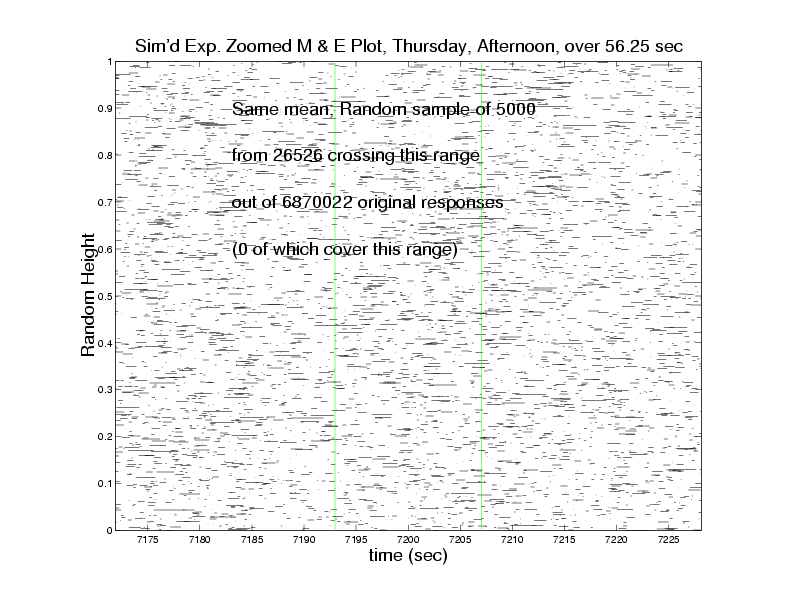
Figure 27. Mice & Elephants over middle 56.25 second interval (sample of 5,000 flows out of 26,526 active in this interval).
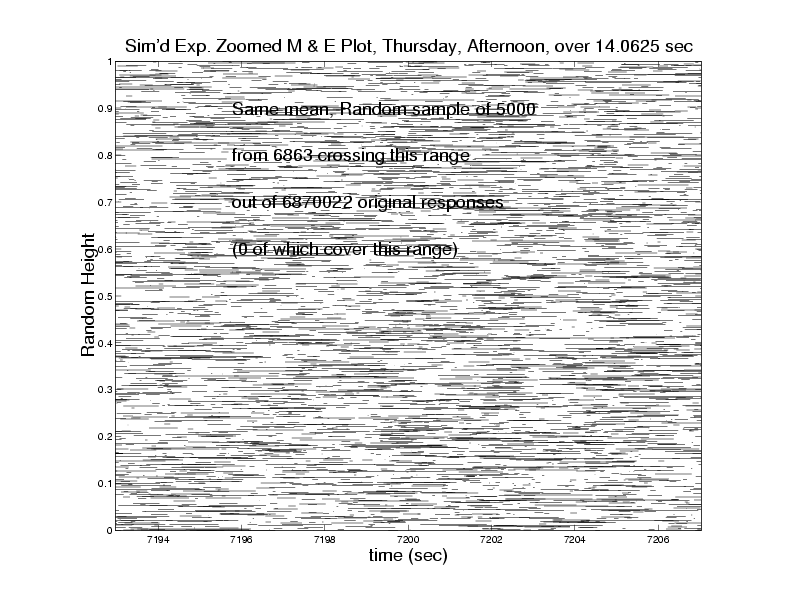
Figure 28. Mice & Elephants over middle 14.063 second interval (sample of 5,000 flows out of 6,863 active in this interval).
The following images can also be found in this .pdf file.
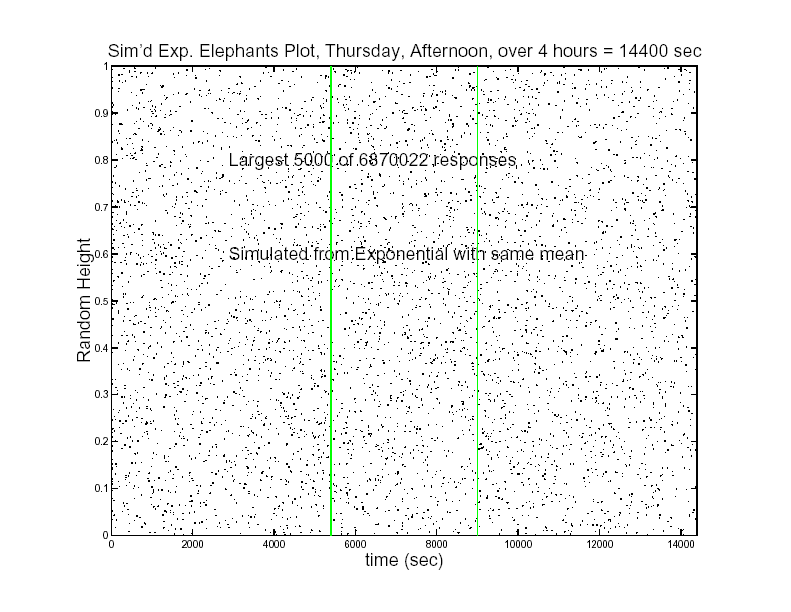
Figure 29. Elephants over four hour synthetic trace (5,000 longest flows out of 6,870,022 active in this interval).
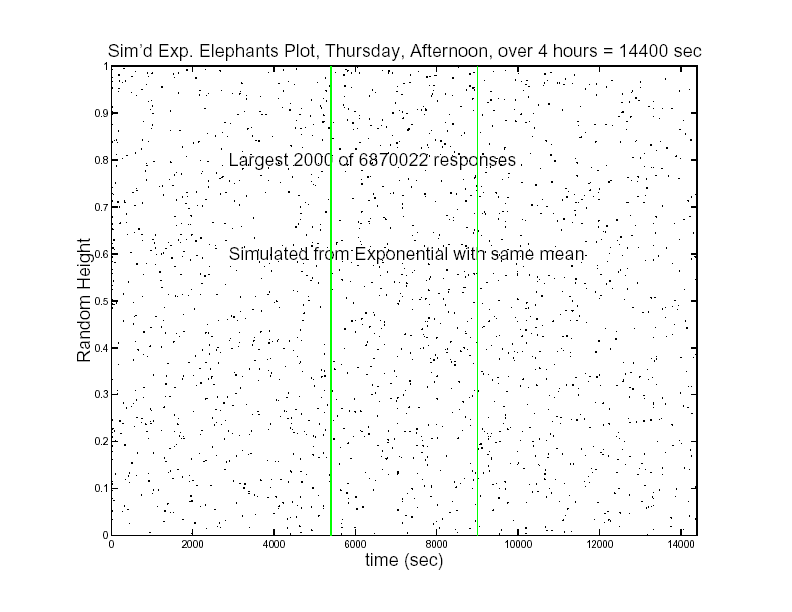
Figure 30. Elephants over four hour synthetic trace (2,000 longest flows out of 6,870,022 active in this interval).
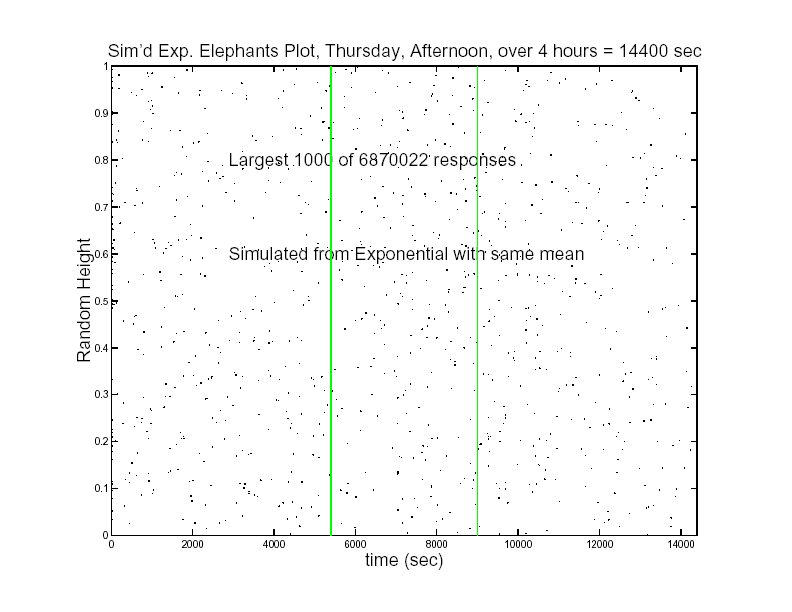
Figure 31. Elephants over four hour synthetic trace (1,000 longest flows out of 6,870,022 active in this interval).
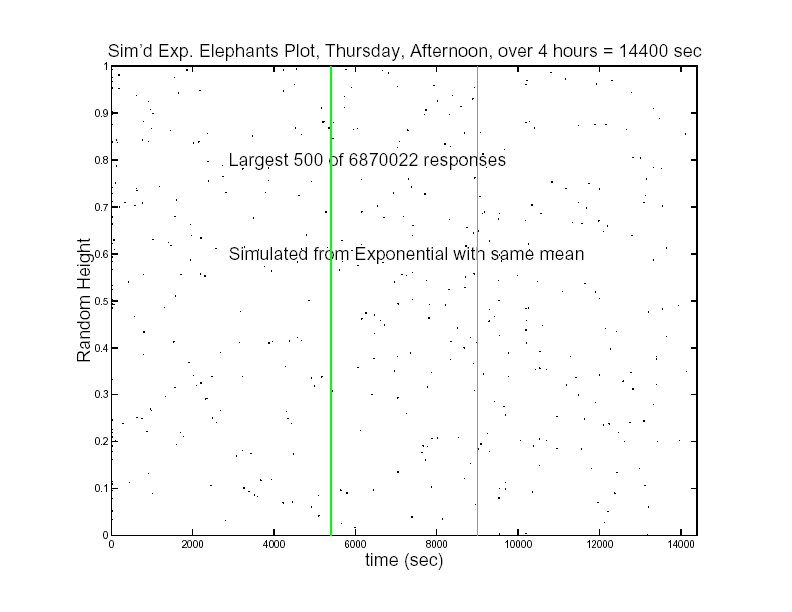
Figure 32. Elephants over four hour synthetic trace (500 longest flows out of 6,870,022 active in this interval).
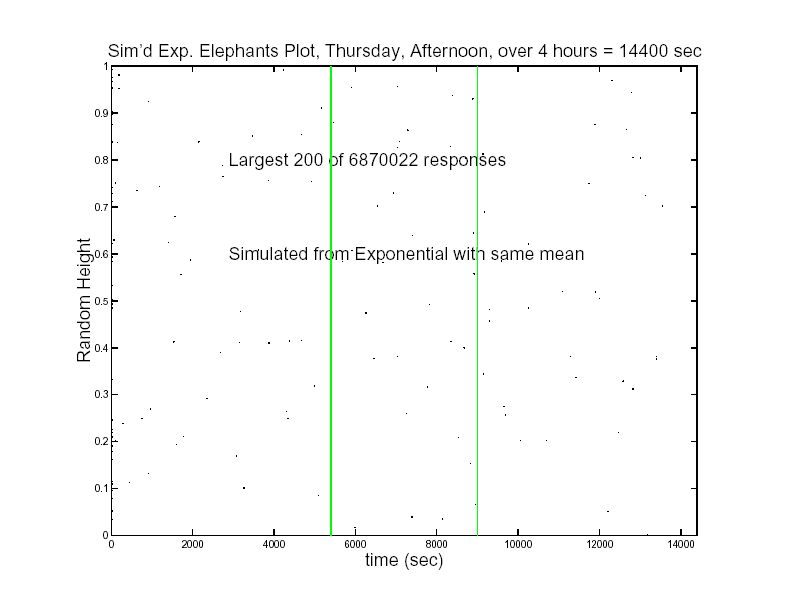
Figure 33. Elephants over four hour synthetic trace (200 longest flows out of 6,870,022 active in this interval).
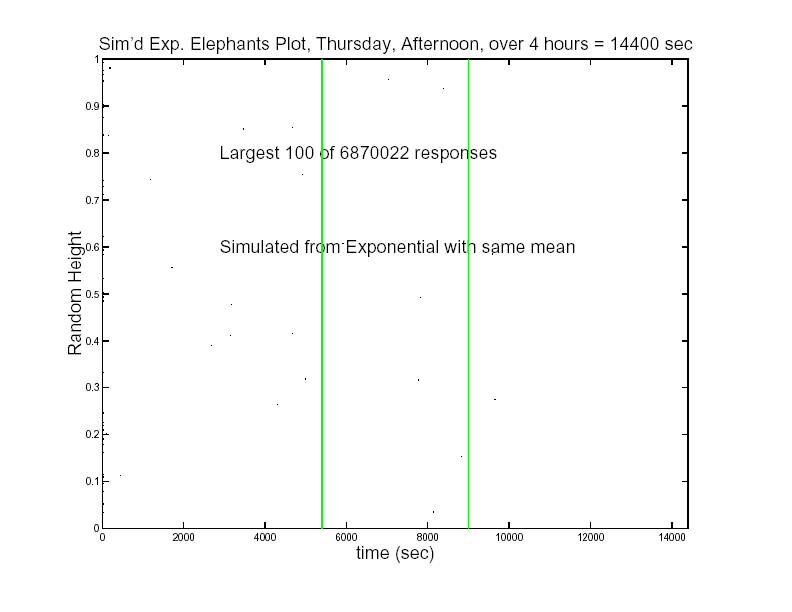
Figure 34. Elephants over four hour synthetic trace (100 longest flows out of 6,870,022 active in this interval).
The following images can also be found in this .pdf file.
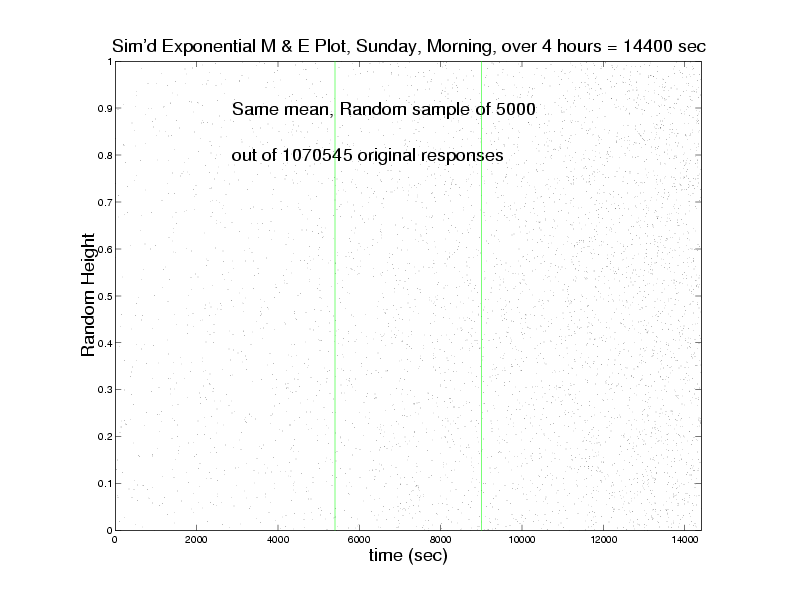
Figure 35. Mice & Elephants over four hour synthetic trace (sample of 5,000 flows out of 1,070,545 active in this interval).
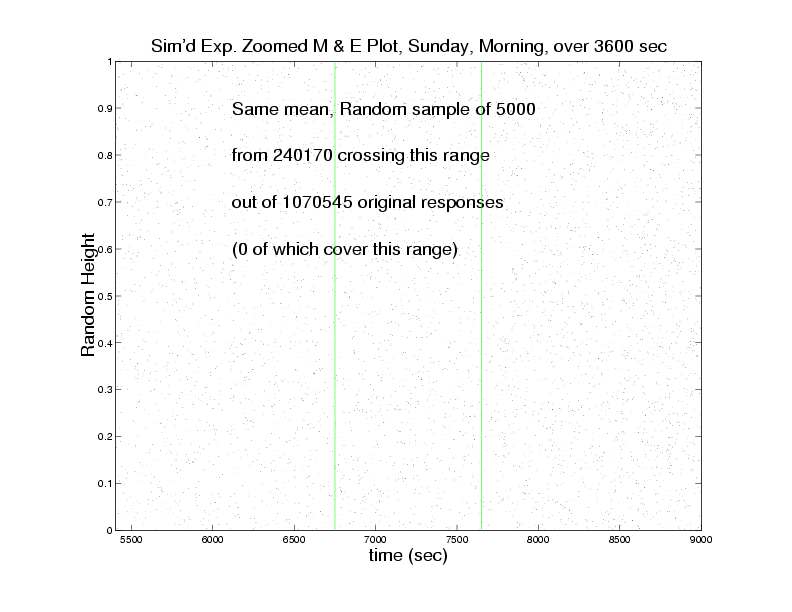
Figure 36. Mice & Elephants over middle 1 hour interval (sample of 5,000 flows out of 240,170 active in this interval).
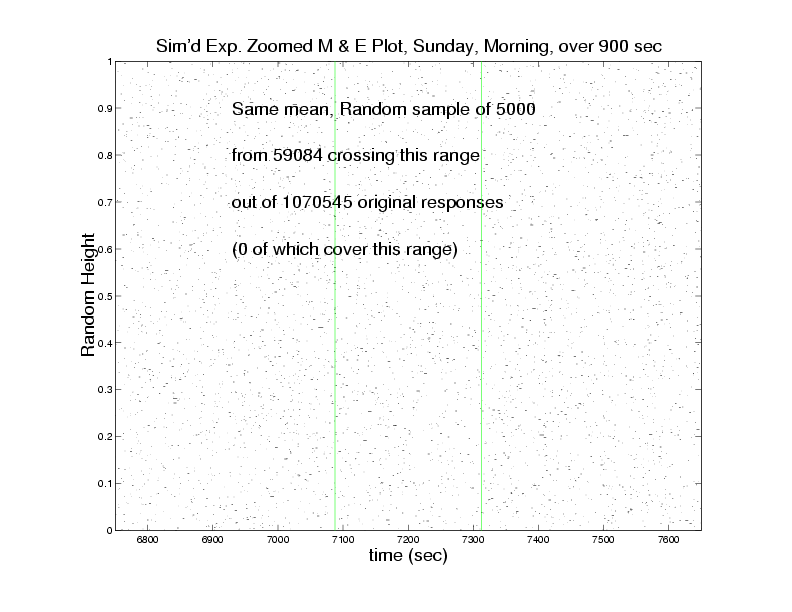
Figure 37. Mice & Elephants over middle 15 minute interval (sample of 5,000 flows out of 59,084 active in this interval).
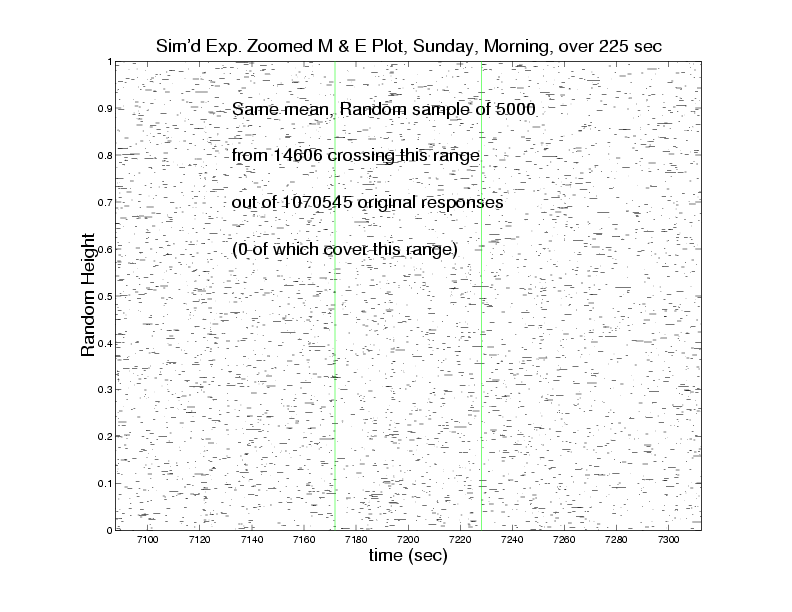
Figure 38. Mice & Elephants over middle 3.75 minute interval (sample of 5,000 flows out of 14,606 active in this interval).
Elephants-only Views for Synthetic Version of Sunday Morning Trace
The following images can also be found in this .pdf file.
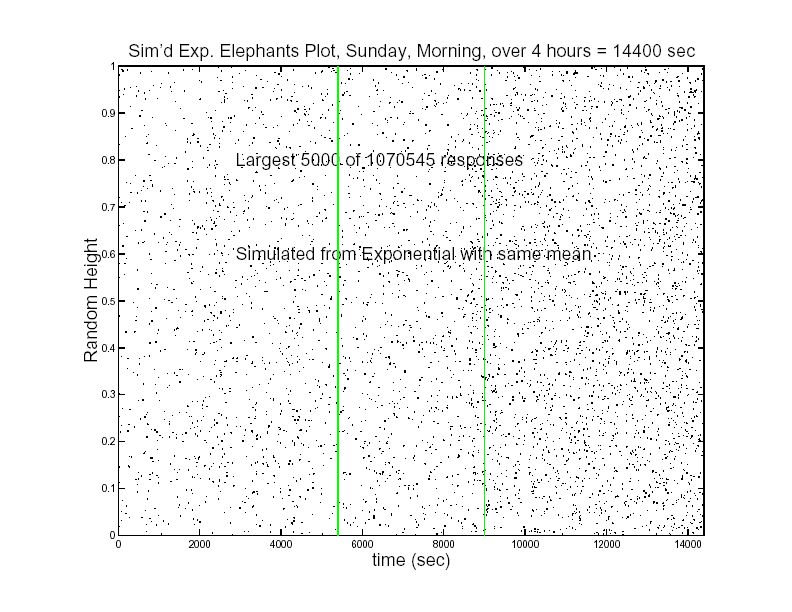
Figure 39. Elephants over four hour synthetic trace (5,000 longest flows out of 1,070,545 active in this interval).
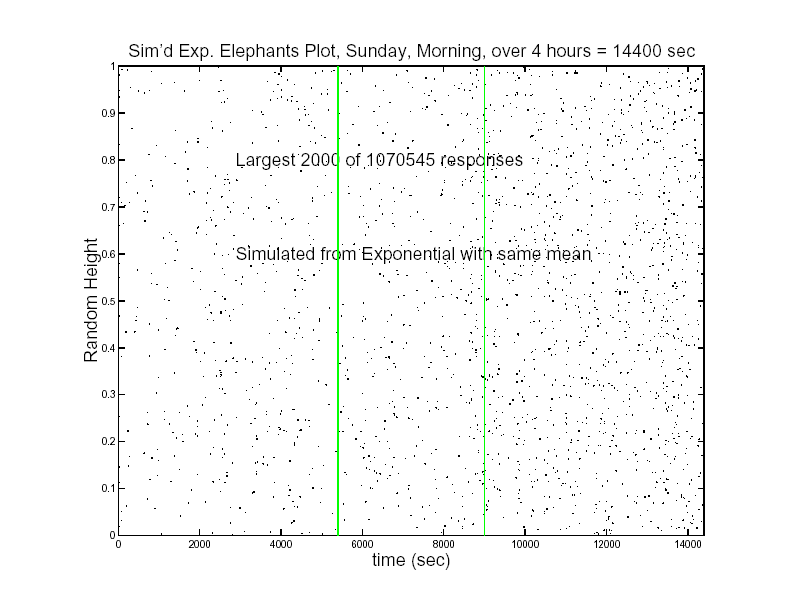
Figure 40. Elephants over four hour synthetic trace (2,000 longest flows out of 1,070,545 active in this interval).
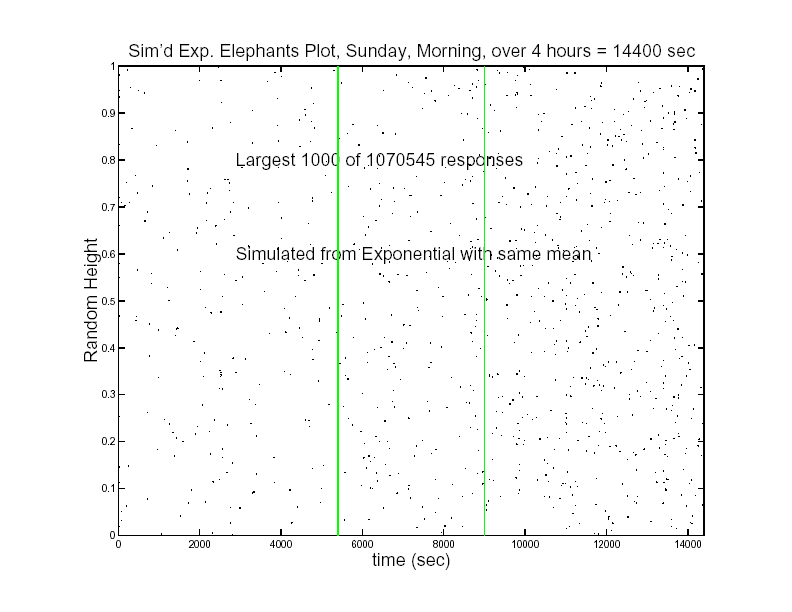
Figure 41. Elephants over four hour synthetic trace (1,000 longest flows out of 1,070,545 active in this interval).
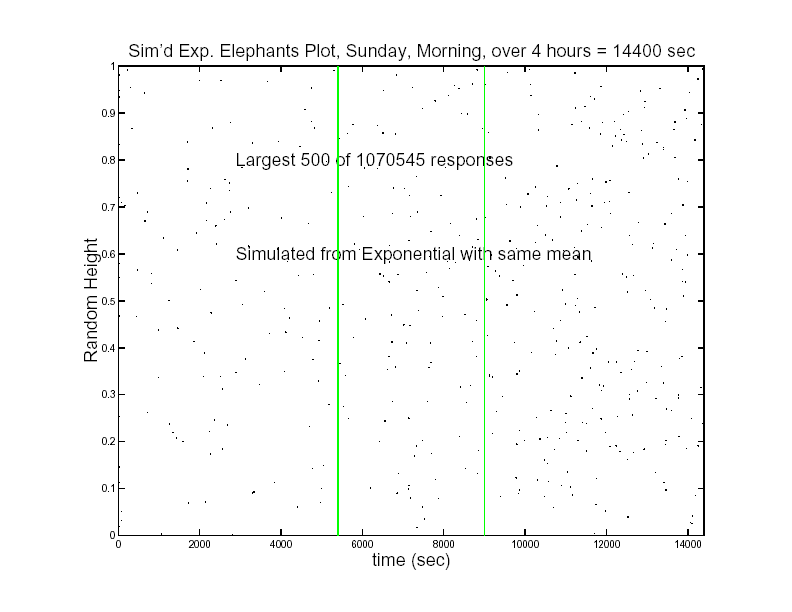
Figure 42. Elephants over four hour synthetic trace (500 longest flows out of 1,070,545 active in this interval).
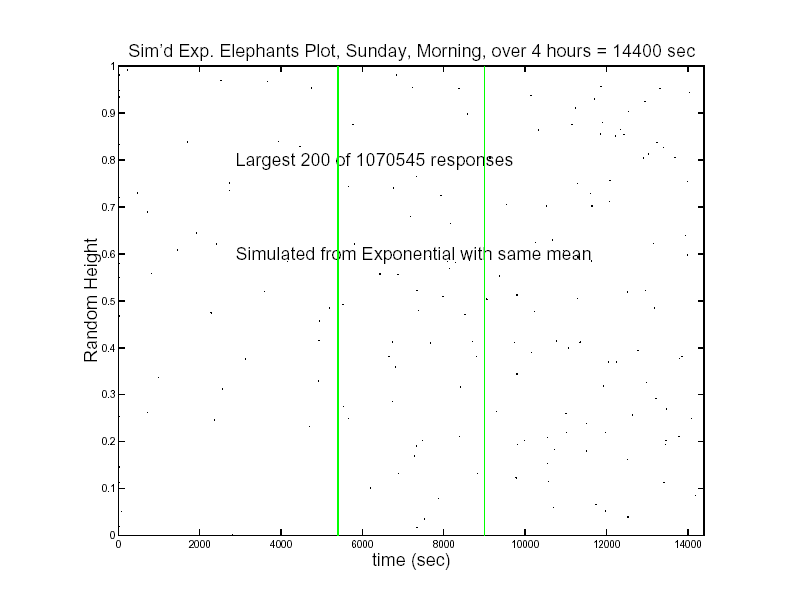
Figure 43. Elephants over four hour synthetic trace (200 longest flows out of 1,070,545 active in this interval).
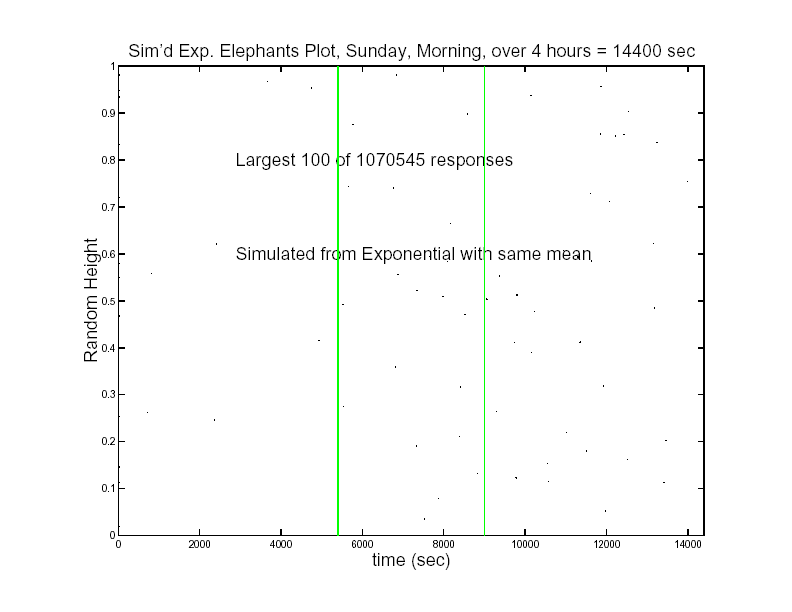
Figure 44. Elephants over four hour synthetic trace (100 longest flows out of 1,070,545 active in this interval).
Steve Marron, Felix Hernández-Campos, F. D. Smith
Last modified: Wed Jun 26 12:06:39 Eastern Standard Time 2002
|

|