|
Internet Traffic Evolution
I have submitted a paper to MASCOTS 2013 describing the results of my Web Traffic Evolution study.
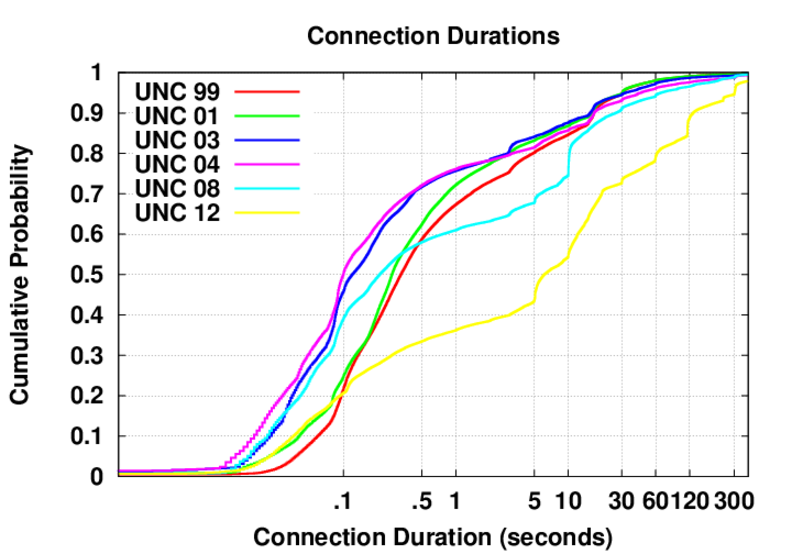
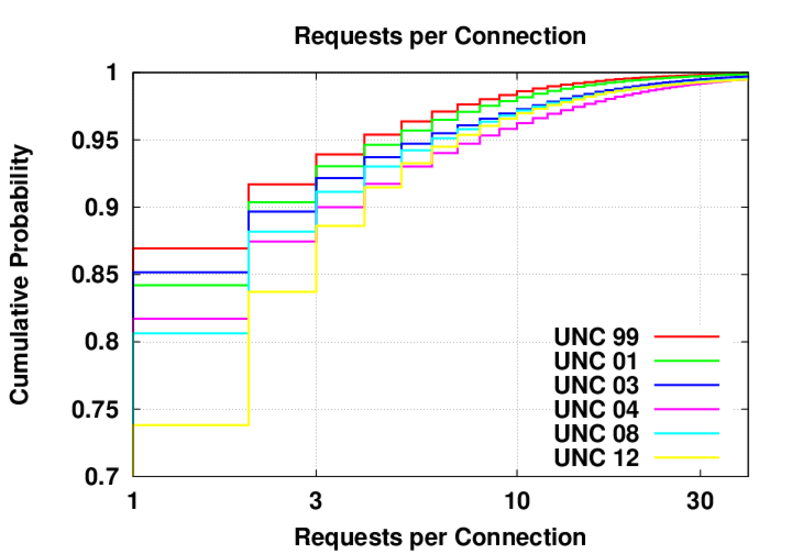
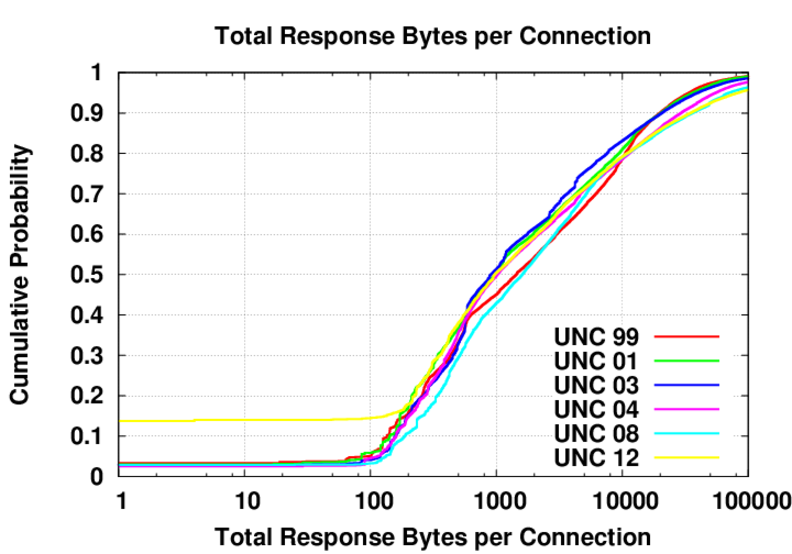
Abstract Over the last decade web content has evolved from relatively static pages often delivered by one or two servers, to websites rich with interactive media content served from numerous servers. This content change has affected the associated network traffic. Quantifying and analyzing these changes can lead to updated traffic models and more accurate web traffic simulations for testing new protocols and devices. In this work we analyze the TCP/IP headers in packet traces collected at various times over 13 years on the link that connects the University of North Carolina at Chapel Hill (UNC) to its ISP. We show that while the decade-old methodology for inferring web activity from these packet traces is still viable, it is no longer possible to infer all page boundaries given only the TCP and IP headers. We propose a novel method for segmenting web traffic into Activity Sections, in order to obtain comparable higher level statistics. Using these methods to analyze our data set, we describe trends in the HTTP request and response sizes, and a trend towards longer connection durations. We also show that the number of servers supporting web activity has increased, and present empirical evidence that suggests the number of unused connections has risen, likely due to new speculative TCP preconnect features of popular browsers.
Color Plots
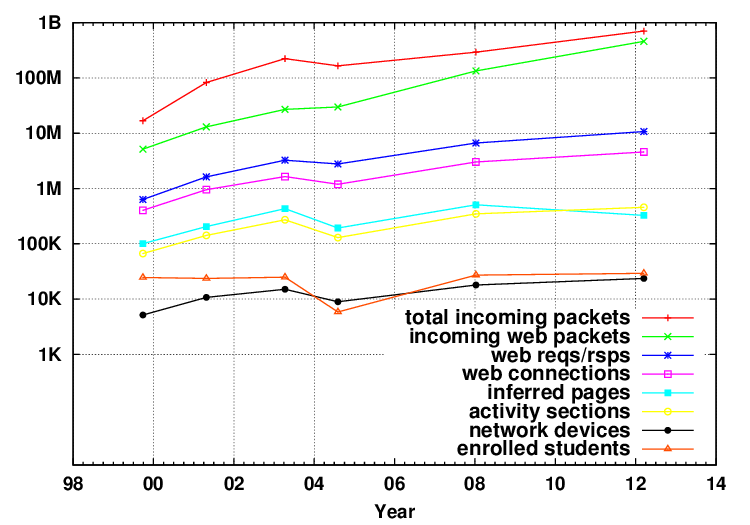
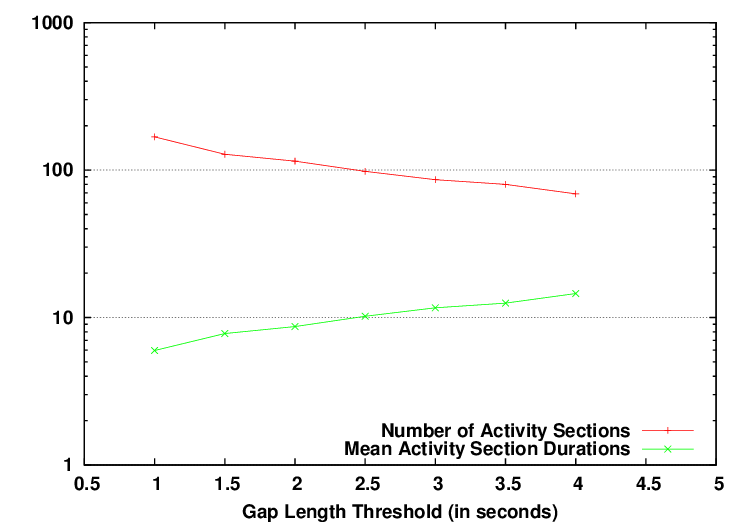
Figure 1.
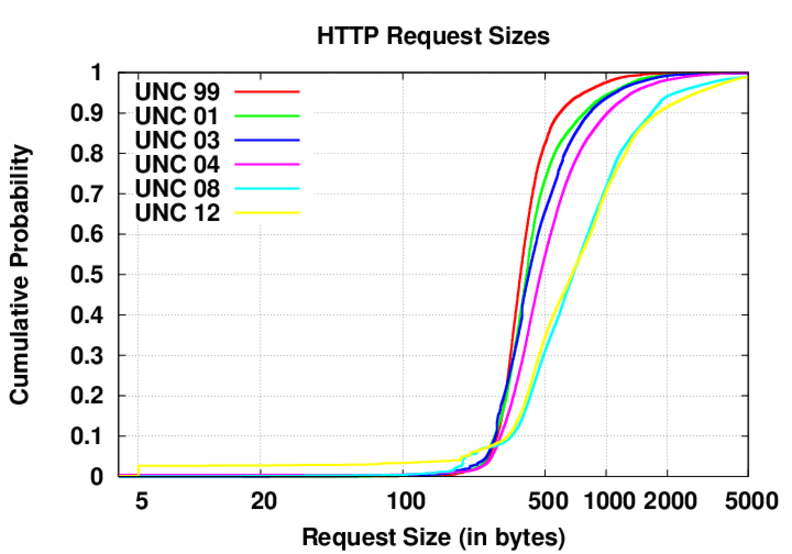
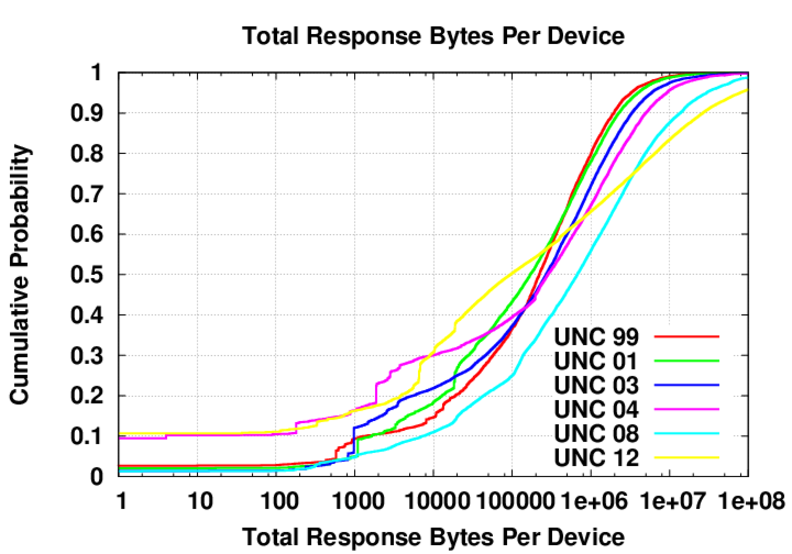
Figure 3.
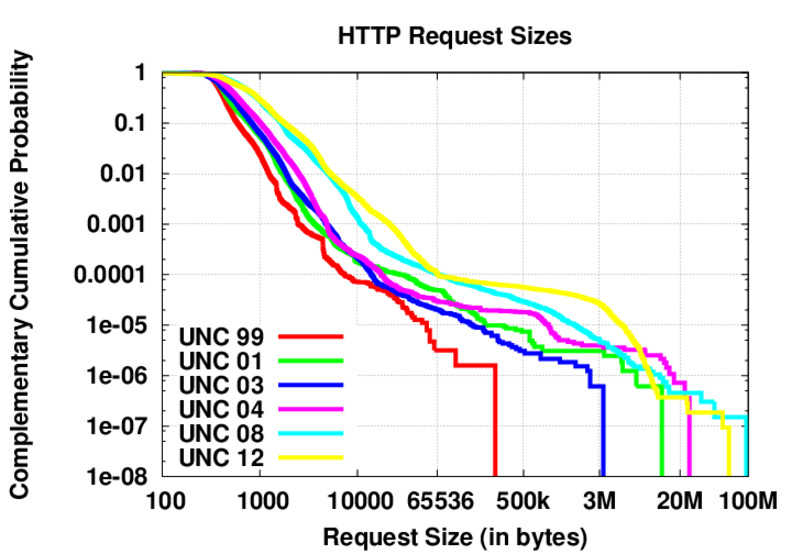
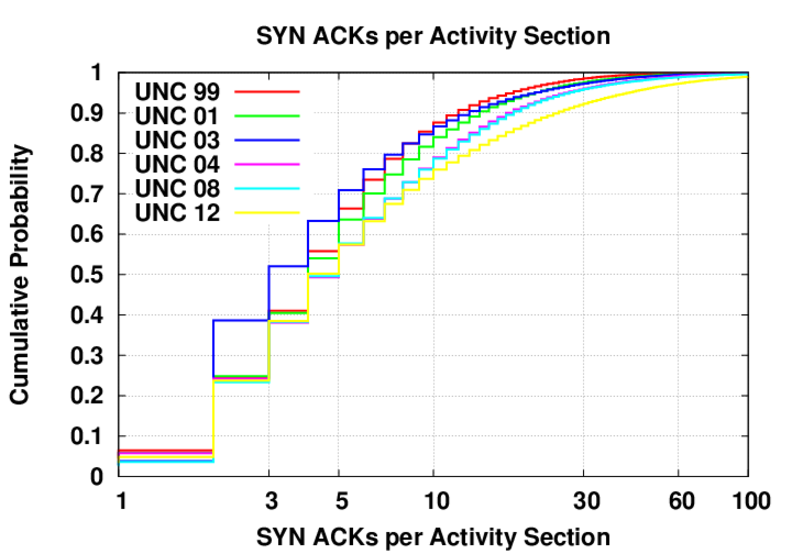
Figure 4.
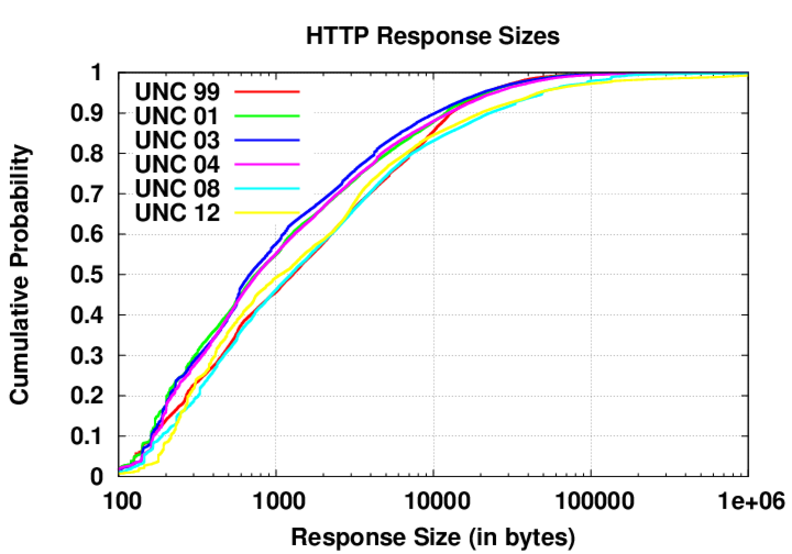
Figure 5.
Figure 6.
Figure 7.
Figure 8.
Figure 9.
Figure 10.
Figure 11.
Figure 12.
Figure 13.
Figure 14.
Detailed research log is here (only internally accessible) All work Copyright Ben Newton 2013 |