Extremal Dependence: Internet Traffic Applications (Version 1)
by
Félix Hernández-Campos,
J. S. Marron,
Sidney I. Resnick
and
Kevin Jeffay
The plots shown here are an expanded set of results for the following paper:
Félix Hernández-Campos, J. S. Marron, Sidney I. Resnick and Kevin Jeffay,
Extremal Dependence: Internet Traffic Applications.
(PDF Version)
The data for these plots are extracted from empirical datasets obtained by tracing TCP/IP packet headers. These traces were created by recording the TCP/IP header of each packet flowing on the network link connecting the UNC Chapel Hill campus to the Internet over 4-hour intervals. A timestamp (with microsecond resolution) was also recorded for each header along with the length in bytes of the packet. All of the traces studied in this paper are from the same week in April, 2001. Additional details on the data collection and processing methods can be found in:
F.D. Smith, F. Hernández-Campos, K. Jeffay, and D. Ott, What TCP/IP Protocol Headers Can Tell Us About the Web, Proceedings of
ACM SIGMETRICS 2001/Performance 2001, Cambridge, MA, June 2001, pages 245-256.
(PDF Version)
The data shown in the plots represent the network transfer times for fetching web objects (HTML pages, embedded images, etc.) by browsers (Netscape or Internet Explorer) used on the UNC-Chapel Hill campus.
This web page includes 73 figures and 6 movies organized in groups according to the studied bivariate dataset. Each group label below is a link to where that group can be found in this page:
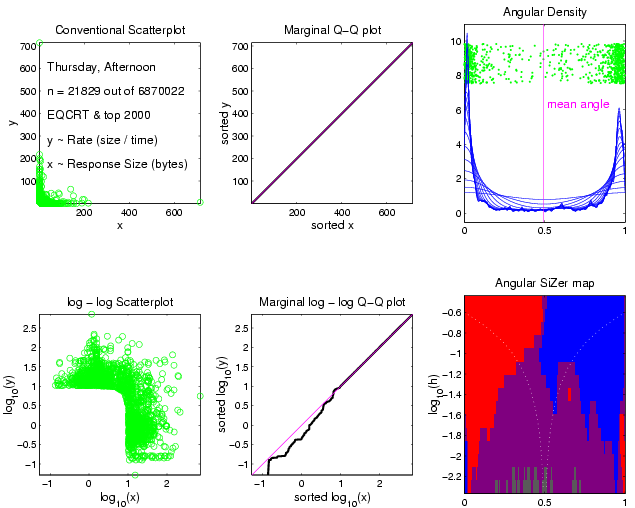
Figure 1. AIRespSiz2srT11t30. (ps)
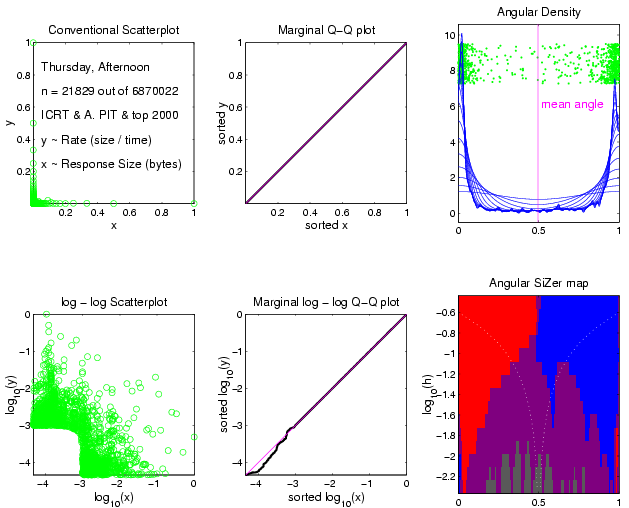
Figure 2. AIRespSiz2srT11t31. (ps)
The following images can also be found in this .pdf file.
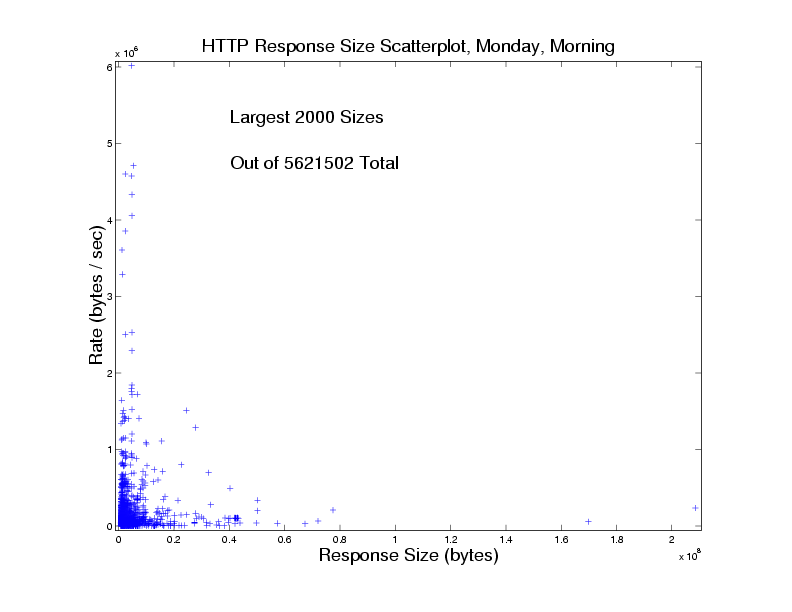
Figure 3. UNC2001RS1SPRScombine.
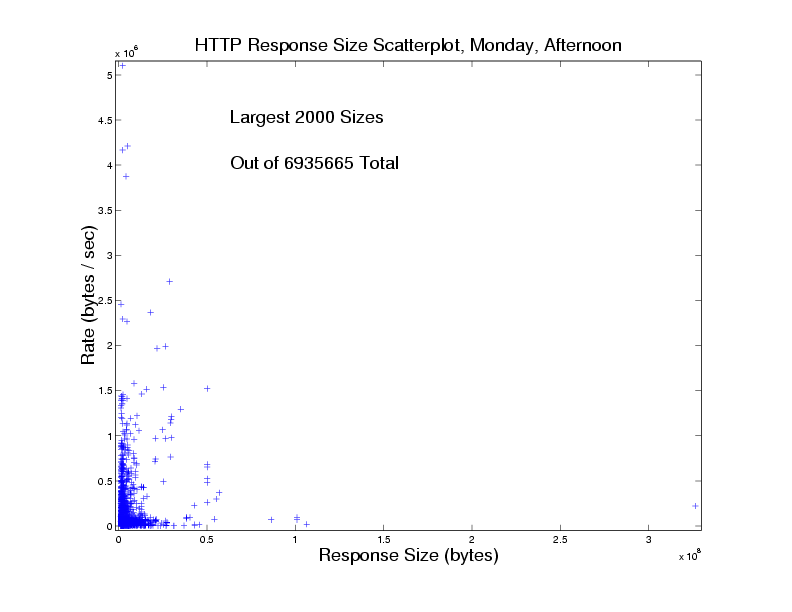
Figure 4. UNC2001RS1SPRScombine.
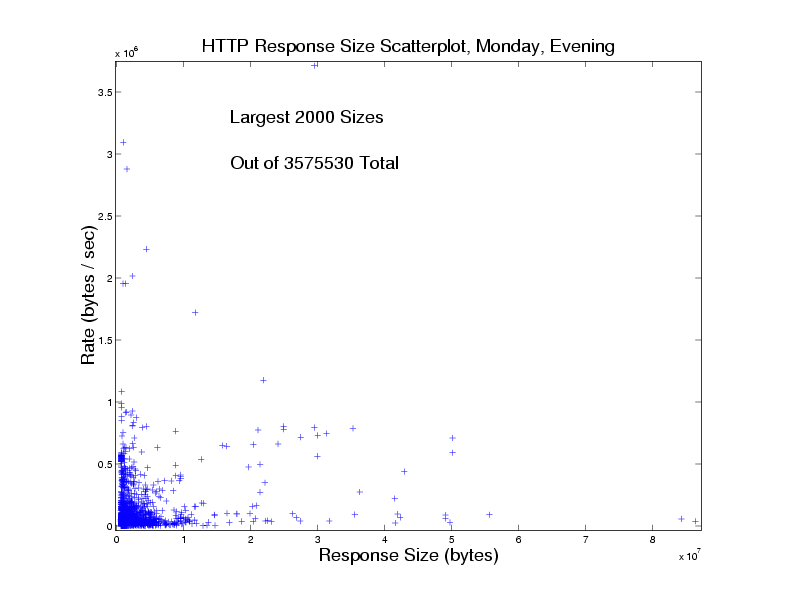
Figure 5. UNC2001RS1SPRScombine.
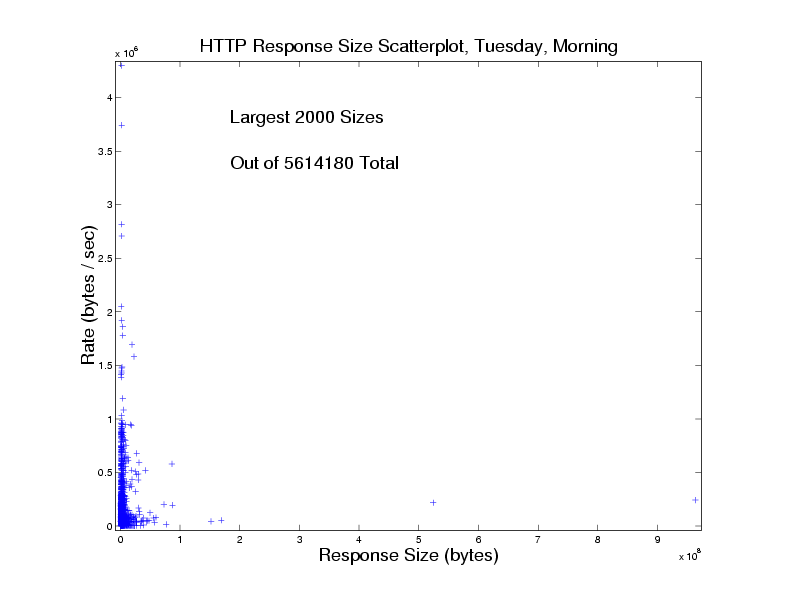
Figure 6. UNC2001RS1SPRScombine.
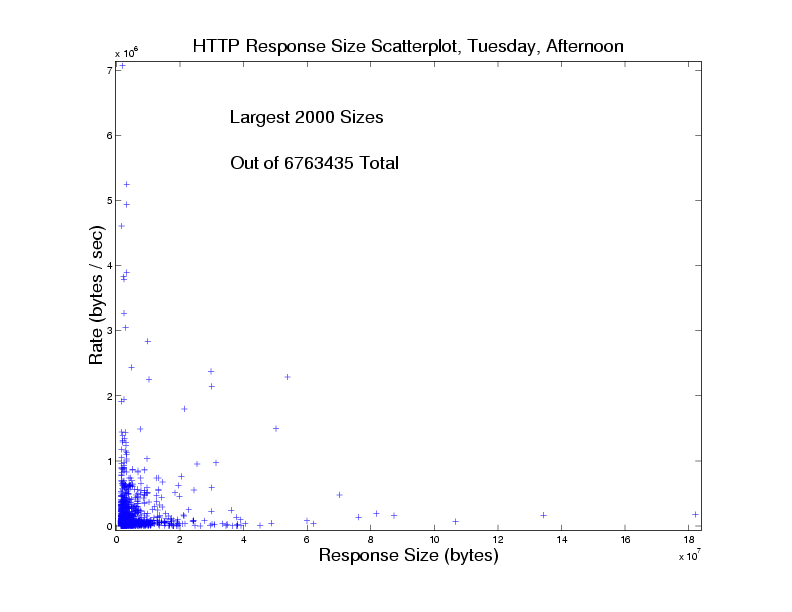
Figure 7. UNC2001RS1SPRScombine.
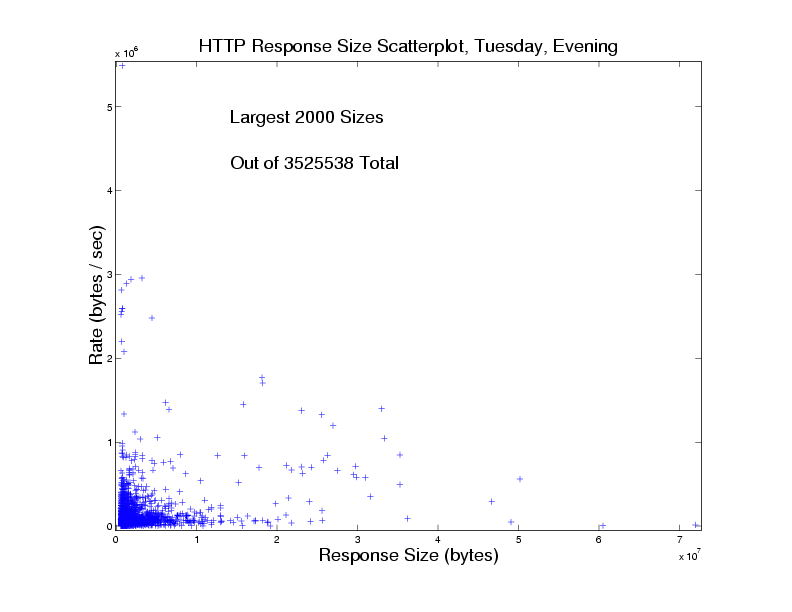
Figure 8. UNC2001RS1SPRScombine.
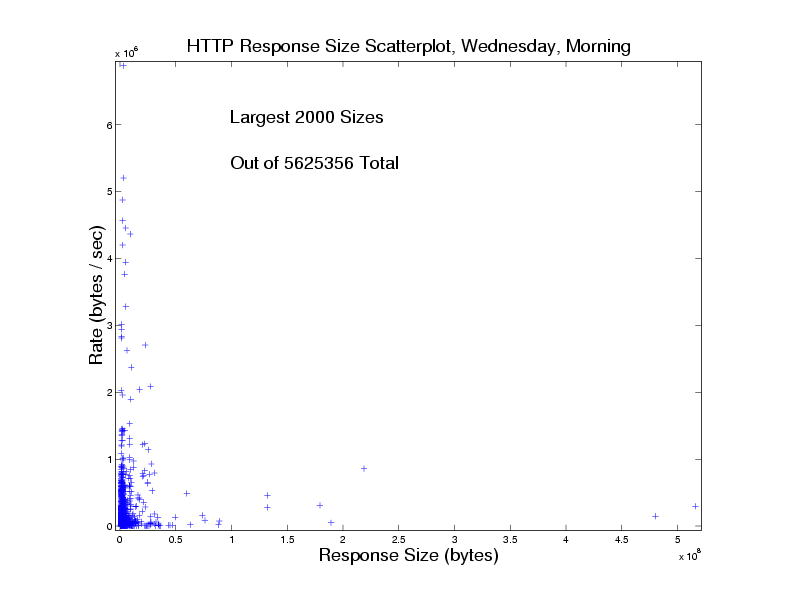
Figure 9. UNC2001RS1SPRScombine.

Figure 10. UNC2001RS1SPRScombine.
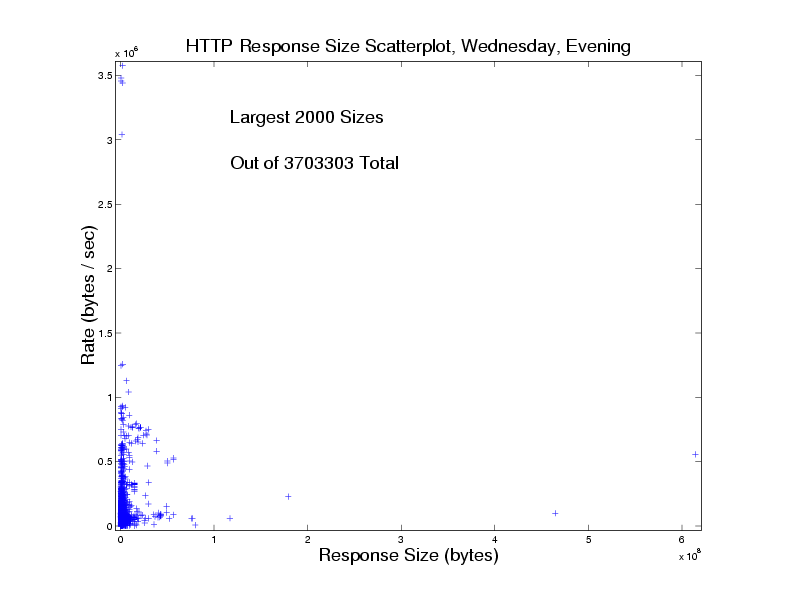
Figure 11. UNC2001RS1SPRScombine.
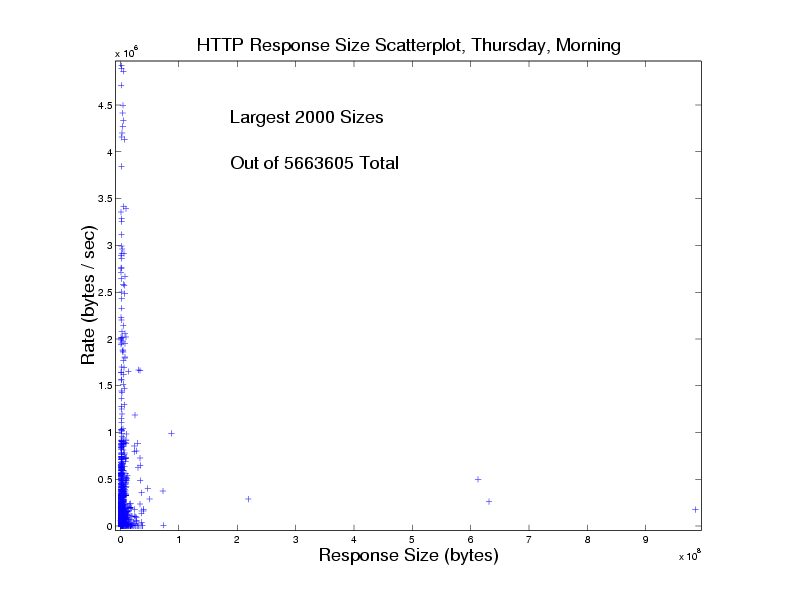
Figure 12. UNC2001RS1SPRScombine.
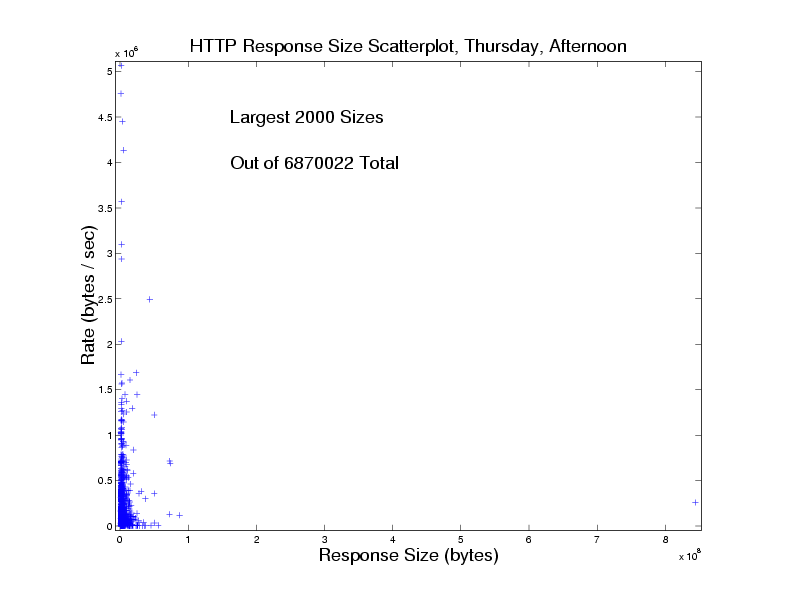
Figure 13. UNC2001RS1SPRScombine.
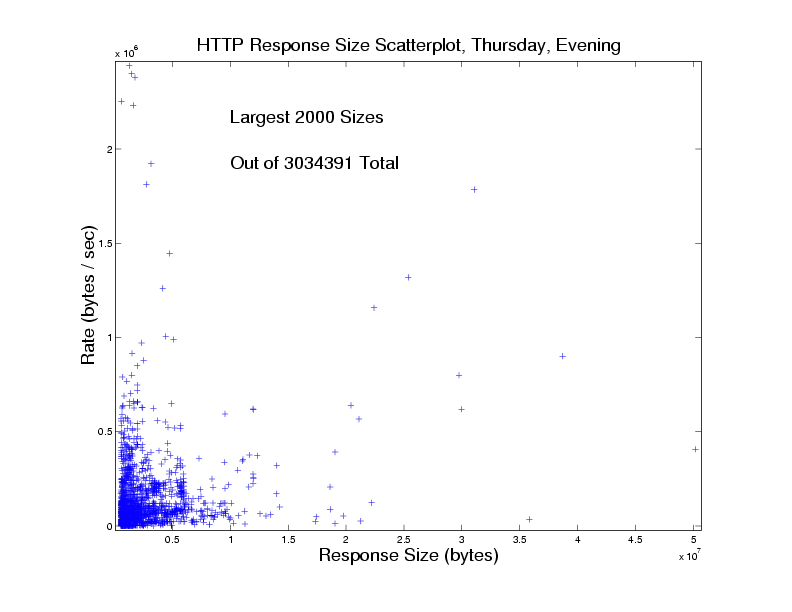
Figure 14. UNC2001RS1SPRScombine.
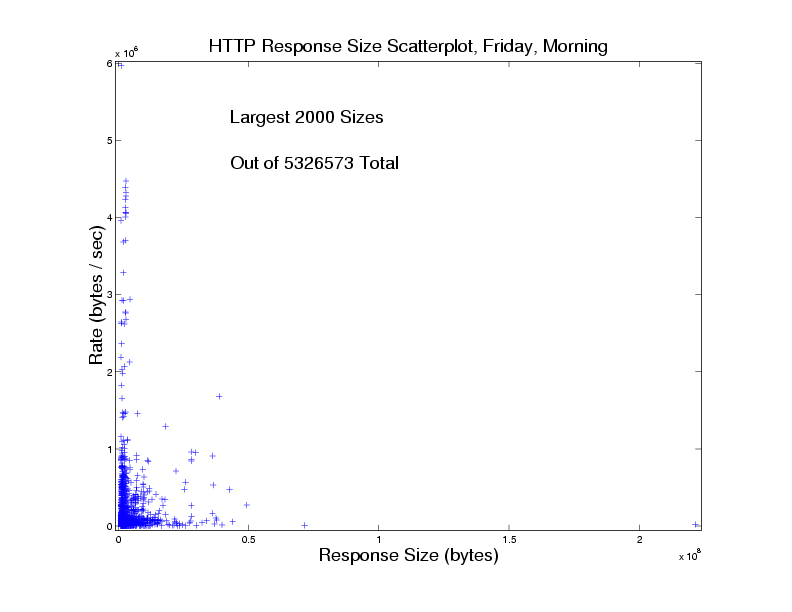
Figure 15. UNC2001RS1SPRScombine.
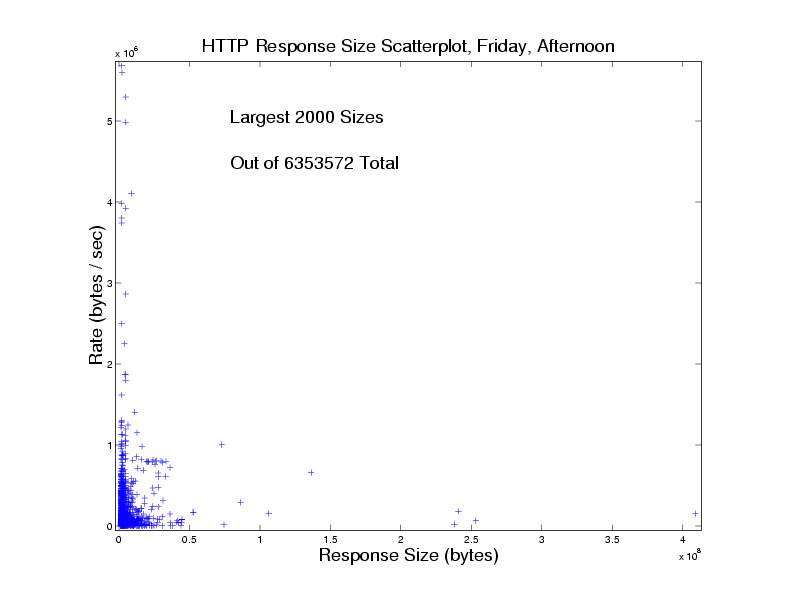
Figure 16. UNC2001RS1SPRScombine.
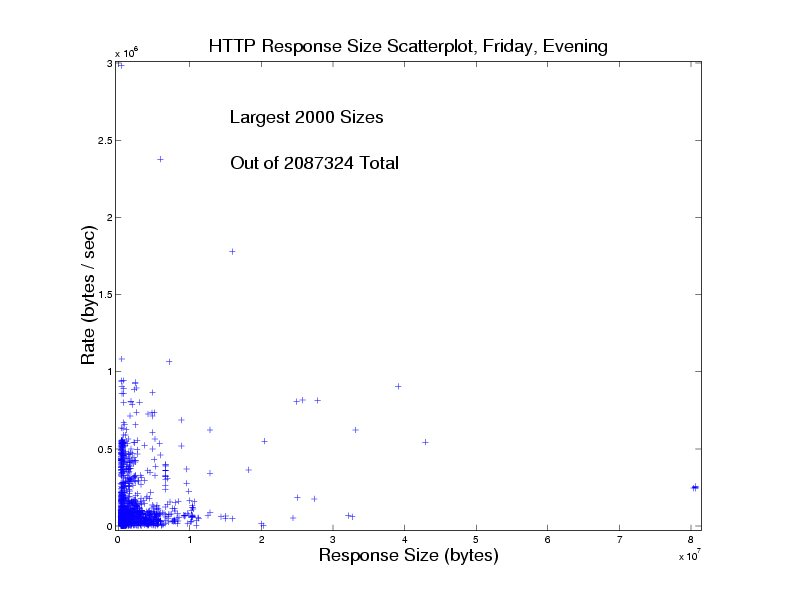
Figure 17. UNC2001RS1SPRScombine.
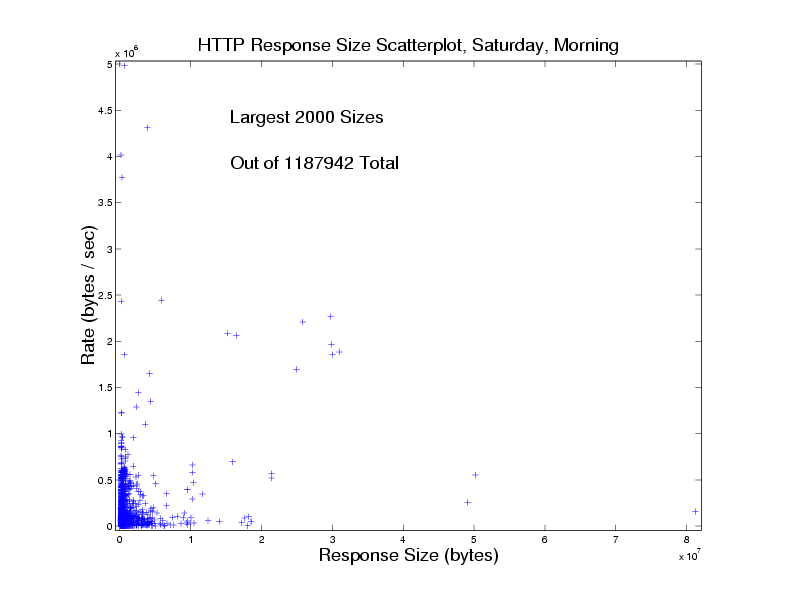
Figure 18. UNC2001RS1SPRScombine.
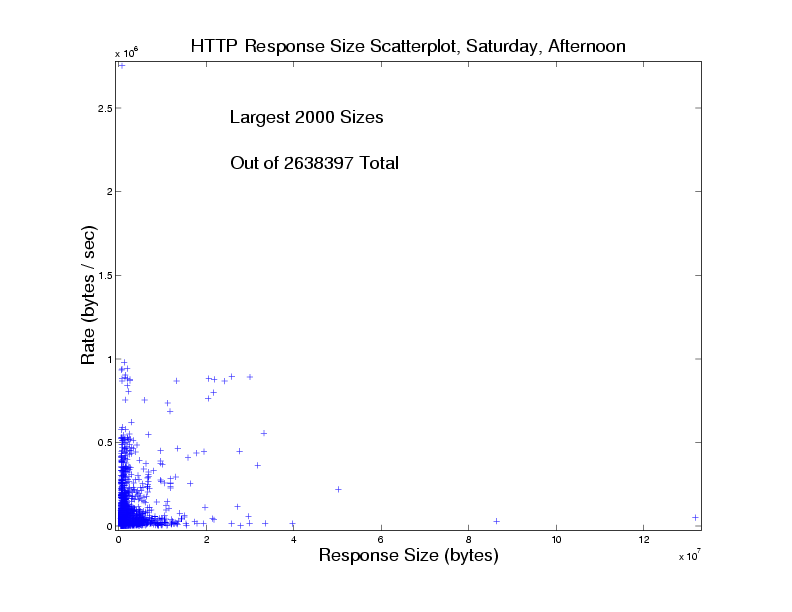
Figure 19. UNC2001RS1SPRScombine.
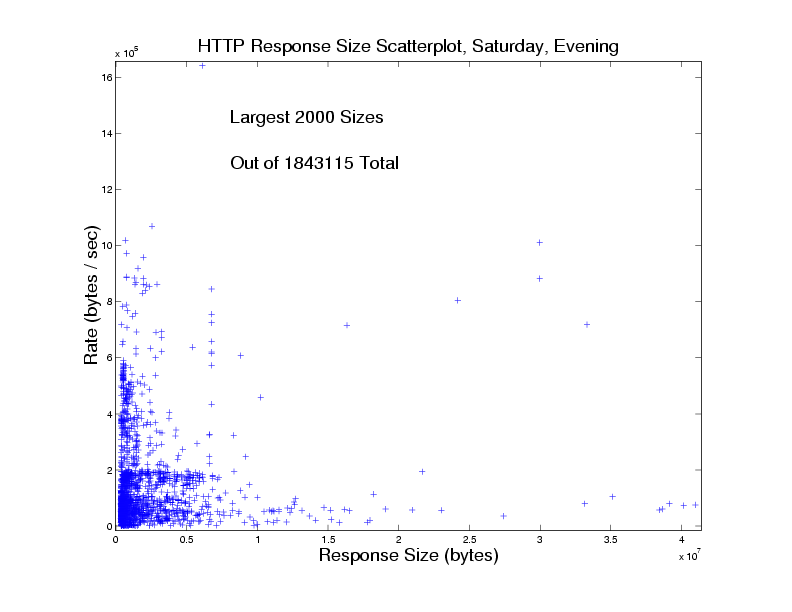
Figure 20. UNC2001RS1SPRScombine.
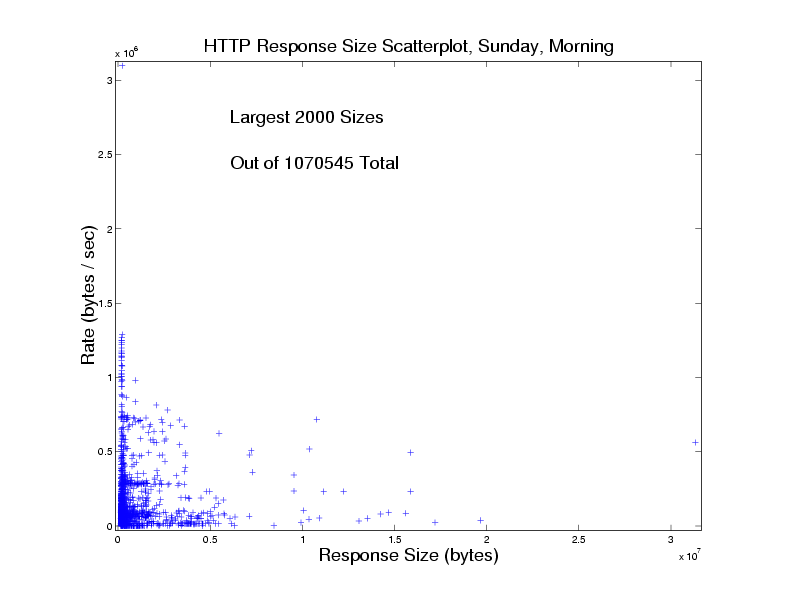
Figure 21. UNC2001RS1SPRScombine.
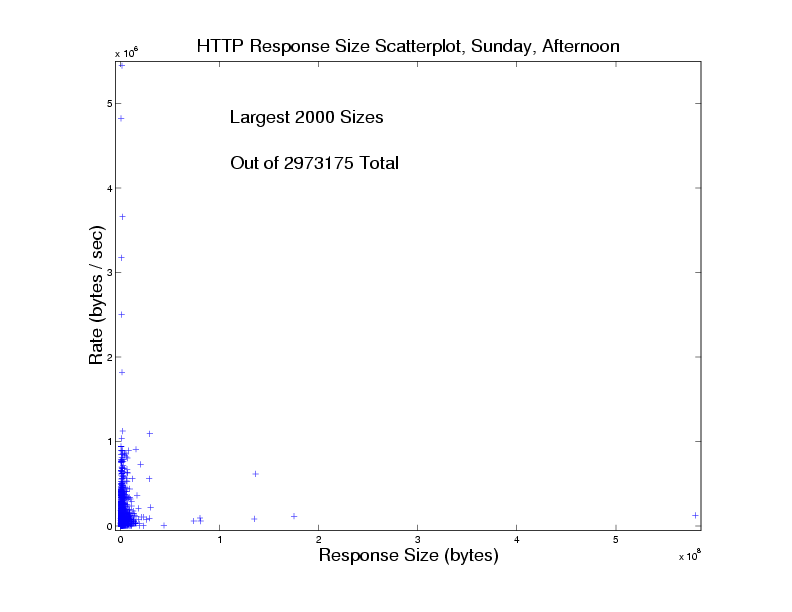
Figure 22. UNC2001RS1SPRScombine.
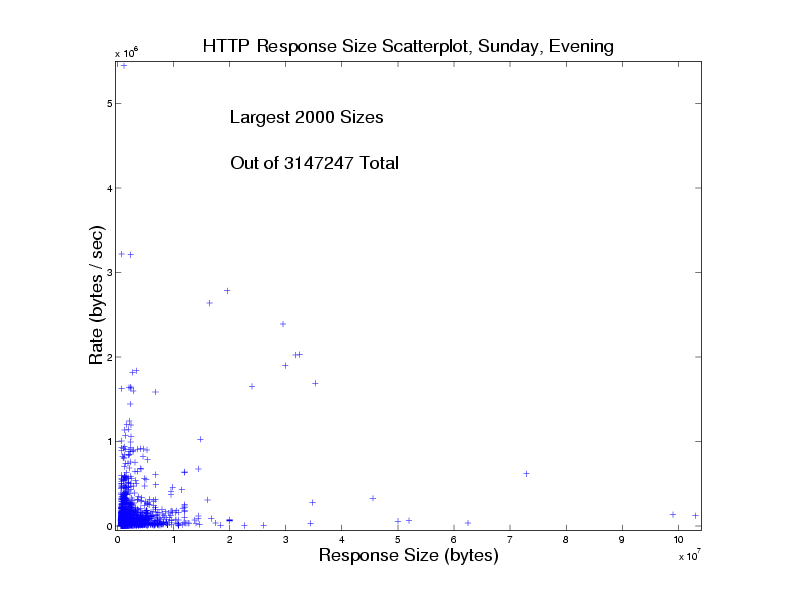
Figure 23. UNC2001RS1SPRScombine.
Figure 24. AIRespSiz2tirT11t25. (ps)
Figure 25. AIRespSiz2tirT11t26. (ps)
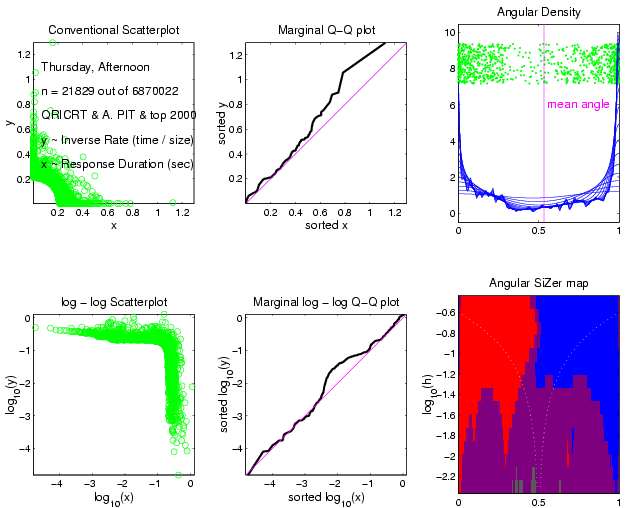
Figure 26. AIRespSiz2tirT11t27. (ps)
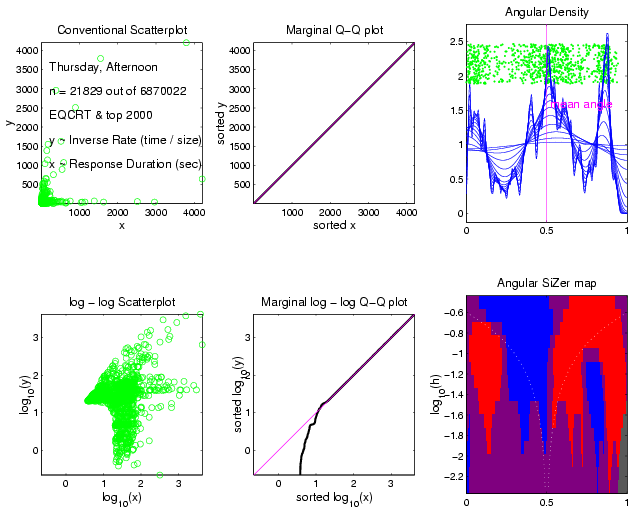
Figure 27. AIRespSiz2tirT11t30. (ps)
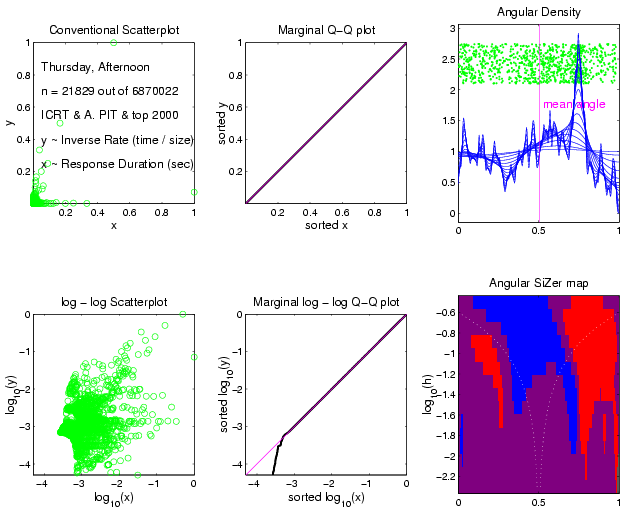
Figure 28. AIRespSiz2tirT11t31. (ps)
Figure 29. AIRespSiz2tirT11t31. (ps)
The following images can also be found in this .pdf file.
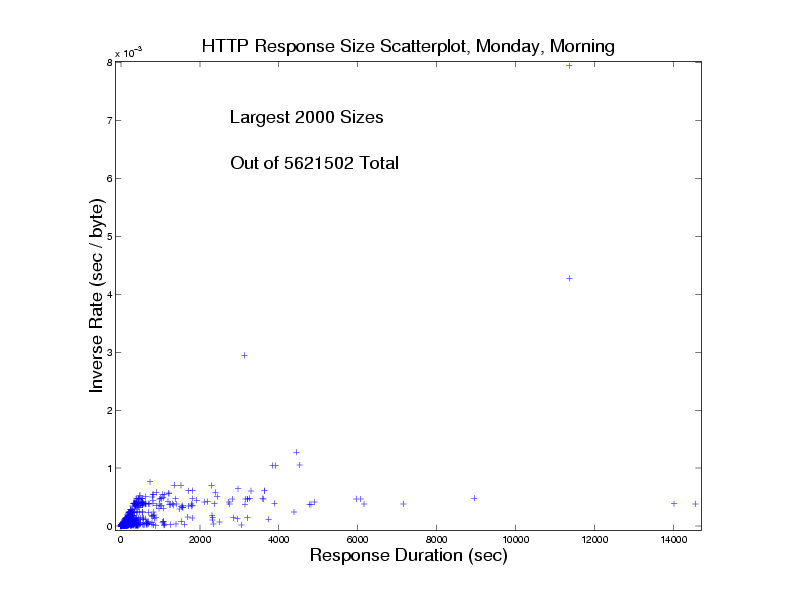
Figure 30. UNC2001RS1SPIRTcombine.
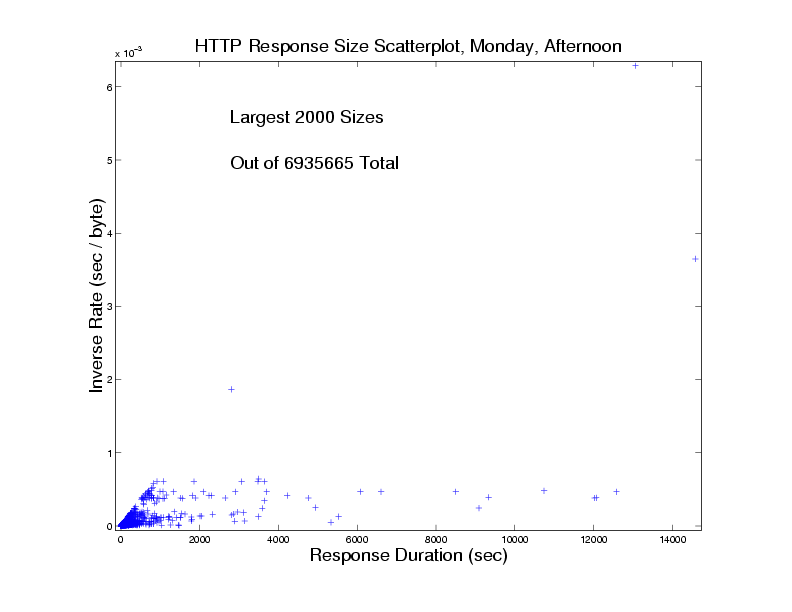
Figure 31. UNC2001RS1SPIRTcombine.
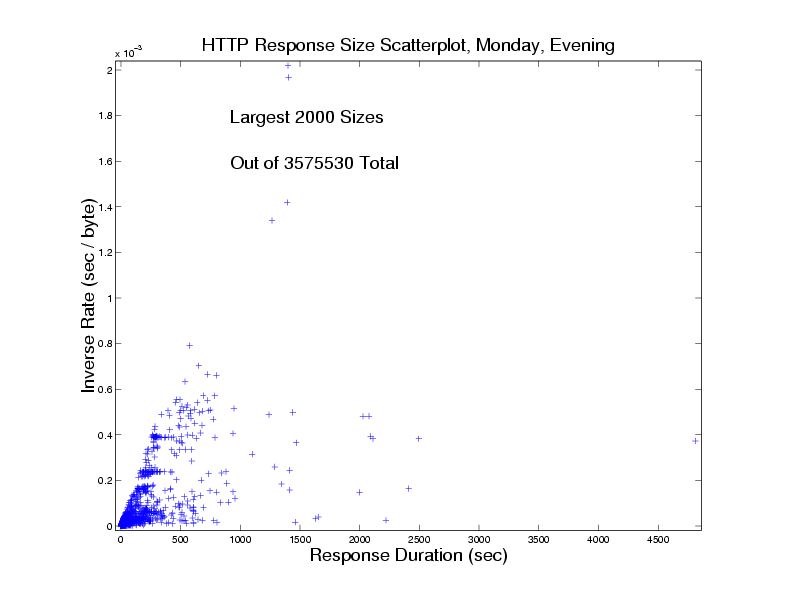
Figure 32. UNC2001RS1SPIRTcombine.
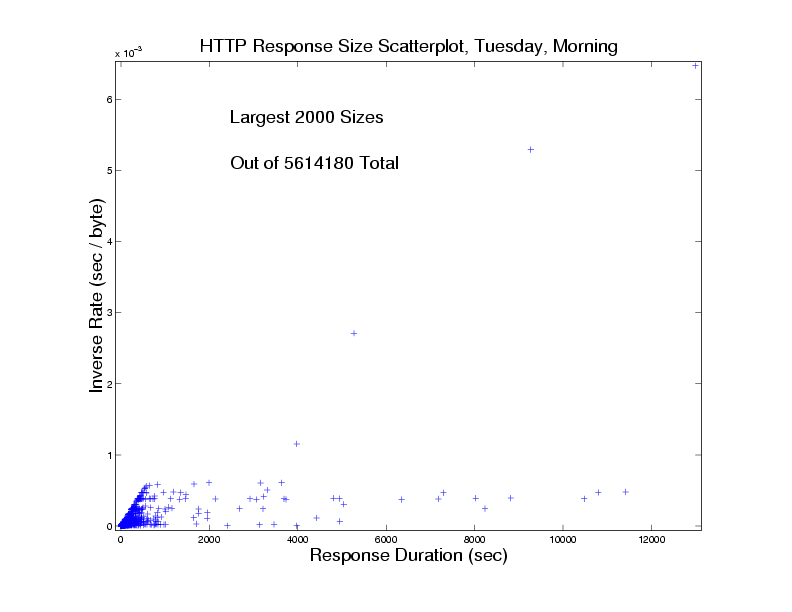
Figure 33. UNC2001RS1SPIRTcombine.

Figure 34. UNC2001RS1SPIRTcombine.
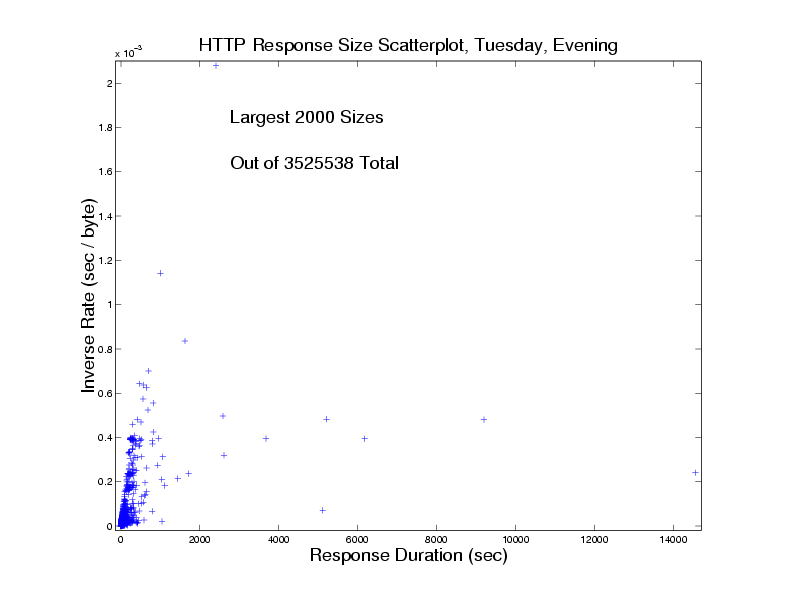
Figure 35. UNC2001RS1SPIRTcombine.
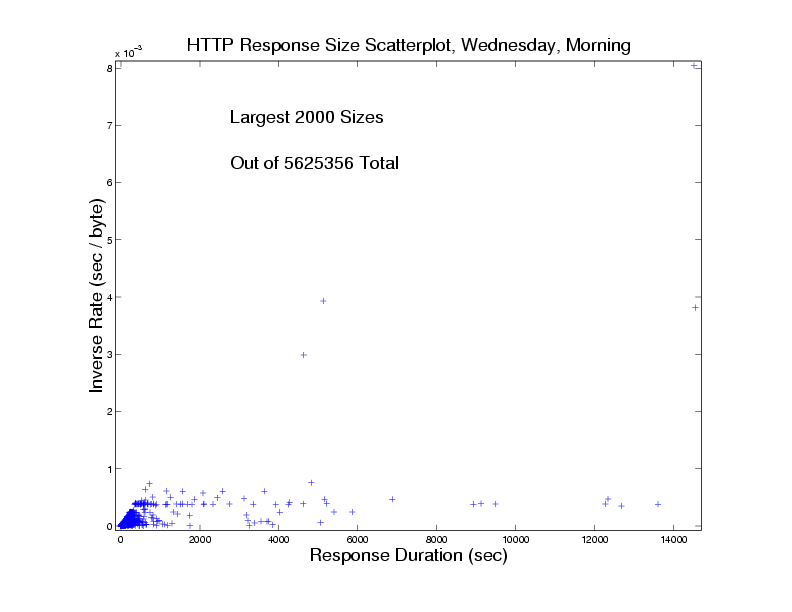
Figure 36. UNC2001RS1SPIRTcombine.
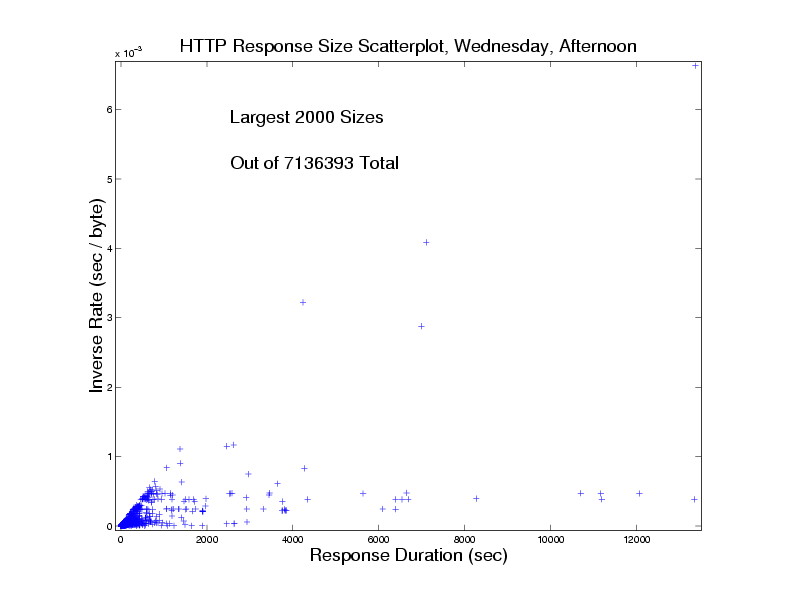
Figure 37. UNC2001RS1SPIRTcombine.
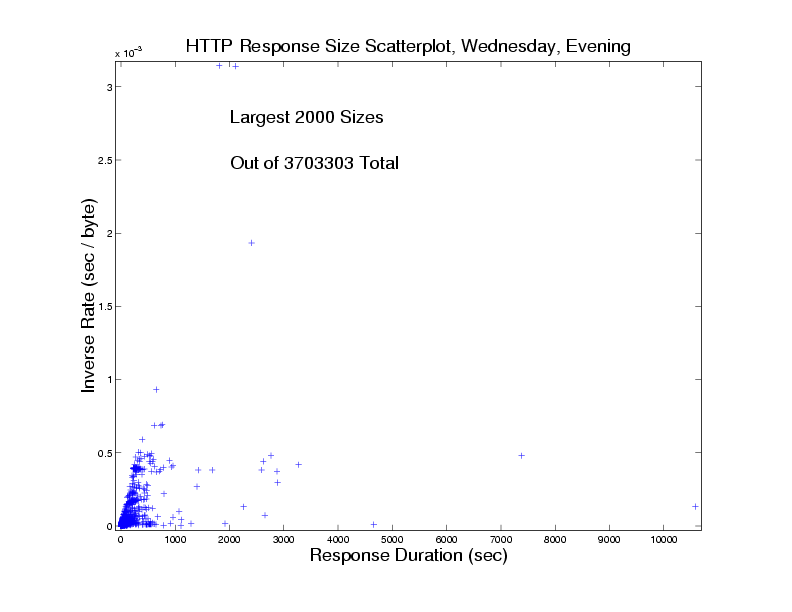
Figure 38. UNC2001RS1SPIRTcombine.
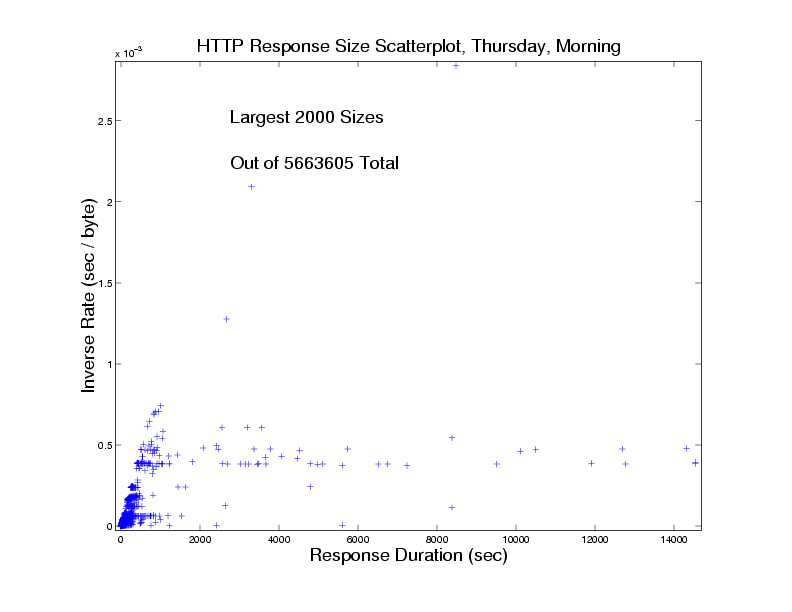
Figure 39. UNC2001RS1SPIRTcombine.

Figure 40. UNC2001RS1SPIRTcombine.
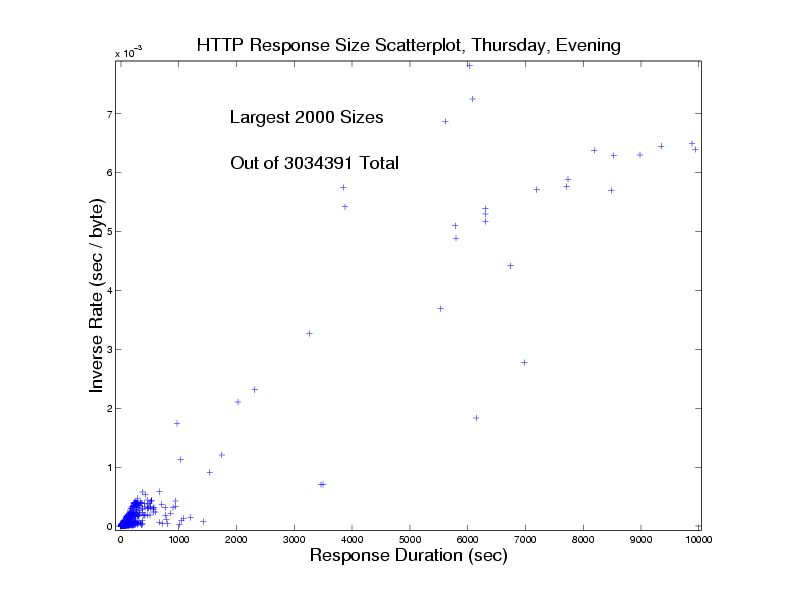
Figure 41. UNC2001RS1SPIRTcombine.
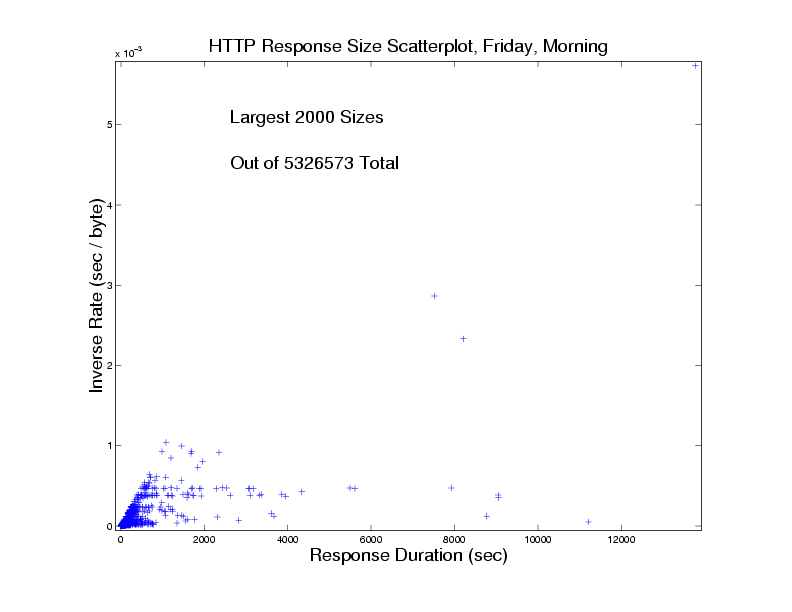
Figure 42. UNC2001RS1SPIRTcombine.

Figure 43. UNC2001RS1SPIRTcombine.

Figure 44. UNC2001RS1SPIRTcombine.
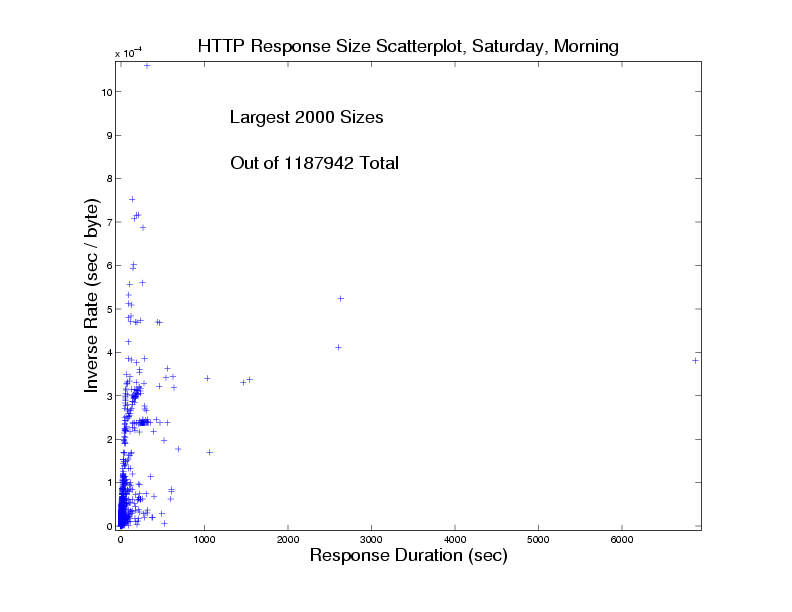
Figure 45. UNC2001RS1SPIRTcombine.

Figure 46. UNC2001RS1SPIRTcombine.
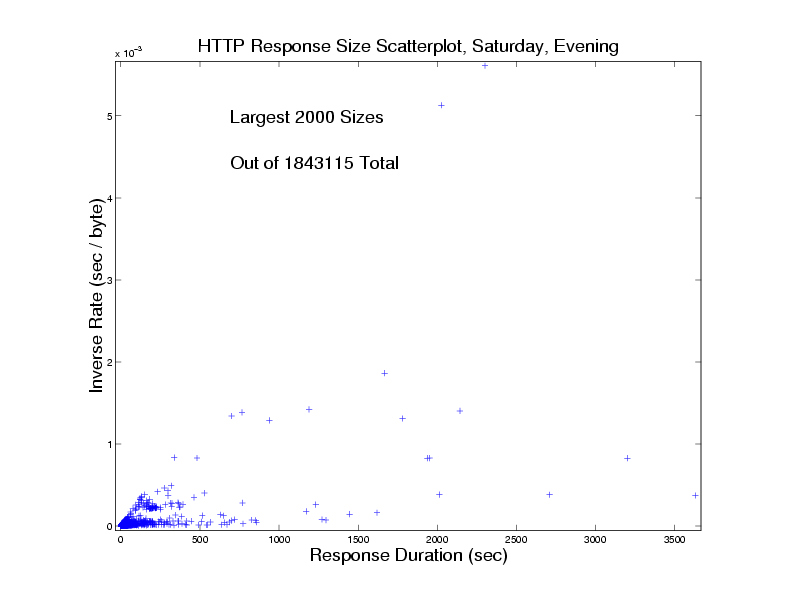
Figure 47. UNC2001RS1SPIRTcombine.
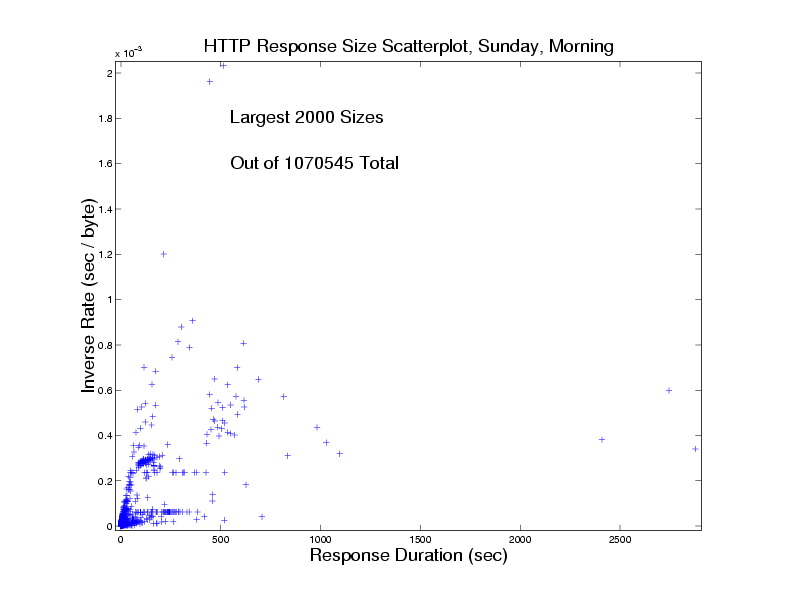
Figure 48. UNC2001RS1SPIRTcombine.
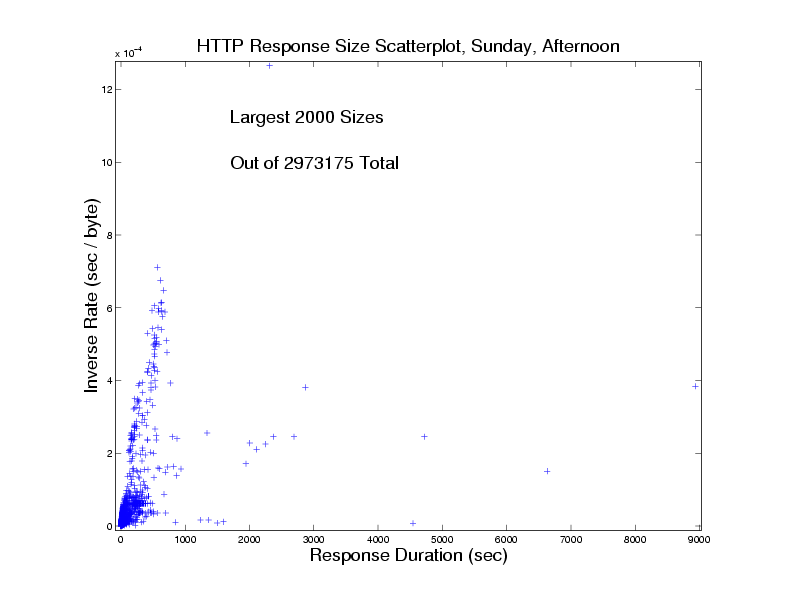
Figure 49. UNC2001RS1SPIRTcombine.

Figure 50. UNC2001RS1SPIRTcombine.
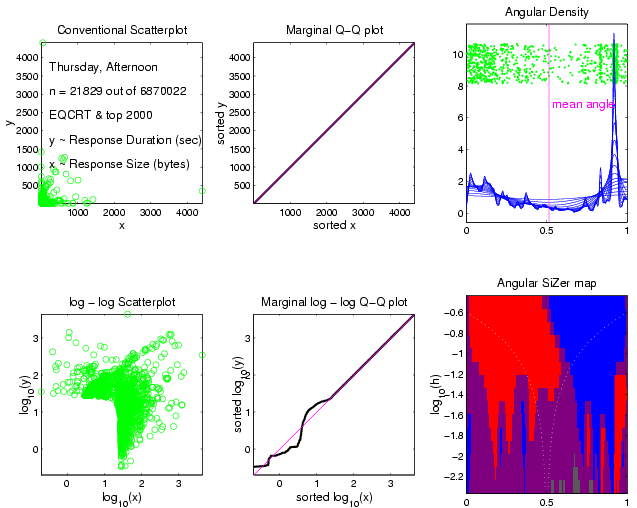
Figure 51. AIRespSiz2stT11t30. (ps)
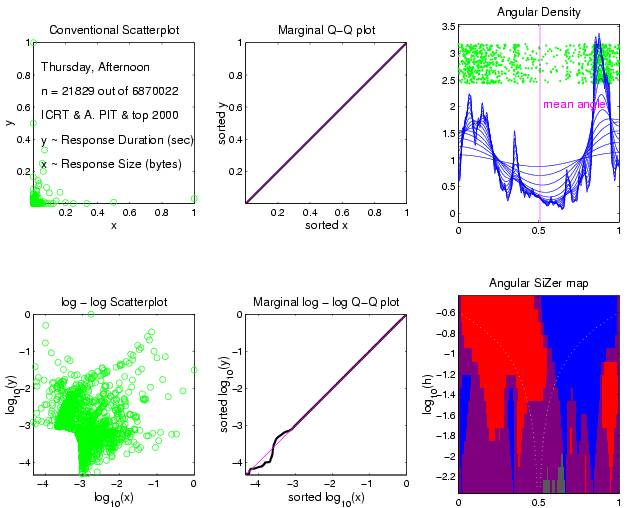
Figure 52. AIRespSiz2stT11t31. (ps)
The following images can also be found in this .pdf file.
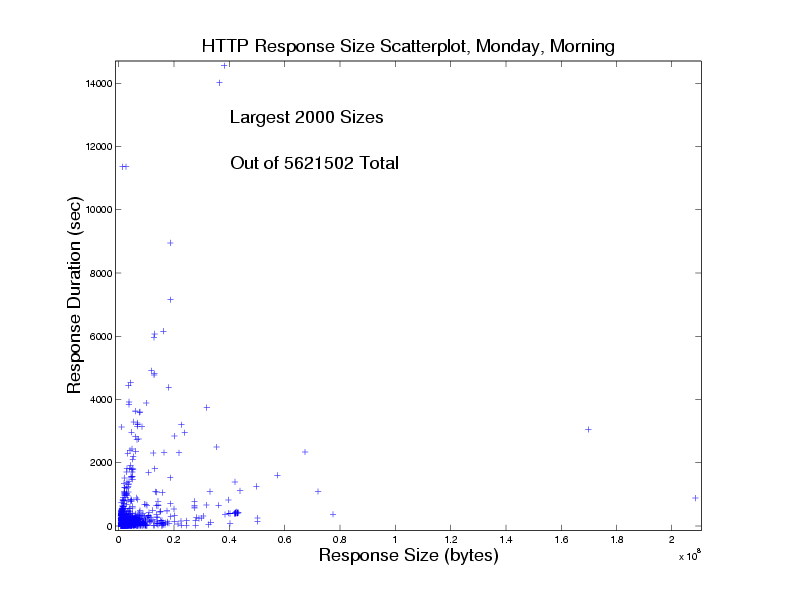
Figure 53. UNC2001RS1SPTScombine.
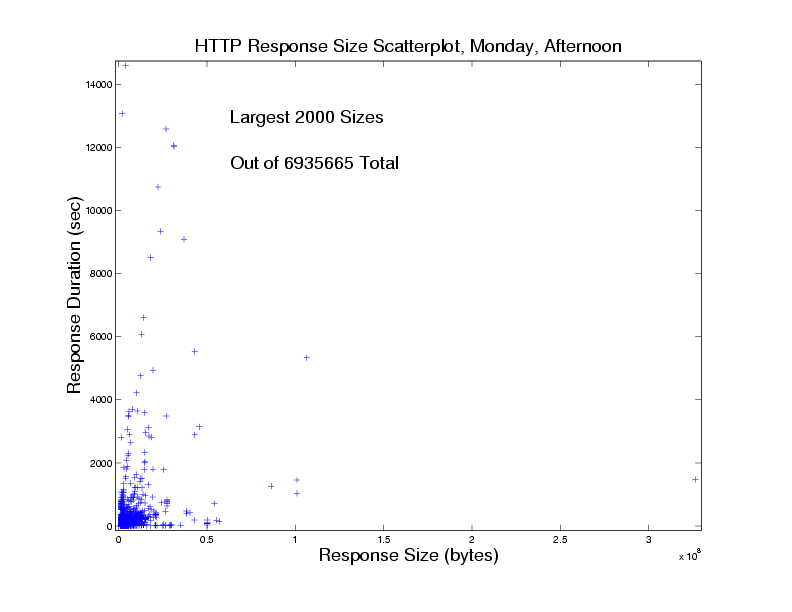
Figure 54. UNC2001RS1SPTScombine.
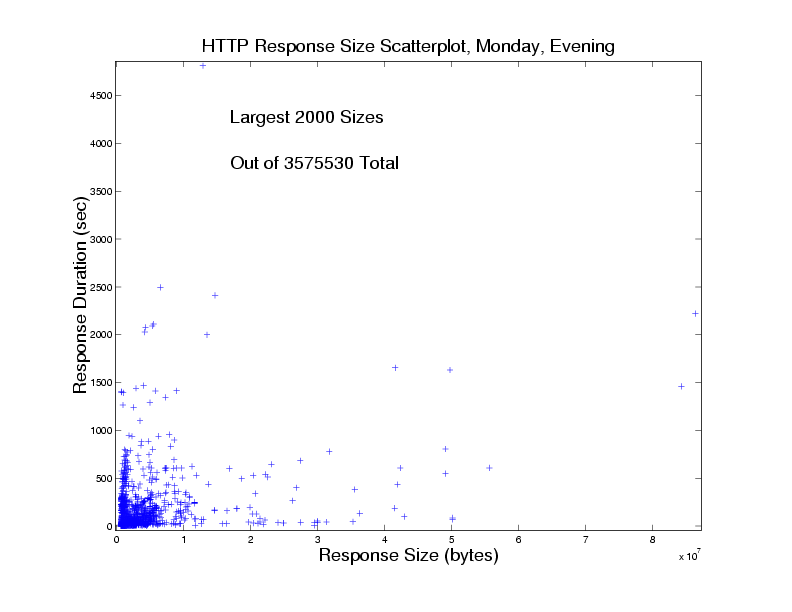
Figure 55. UNC2001RS1SPTScombine.

Figure 56. UNC2001RS1SPTScombine.
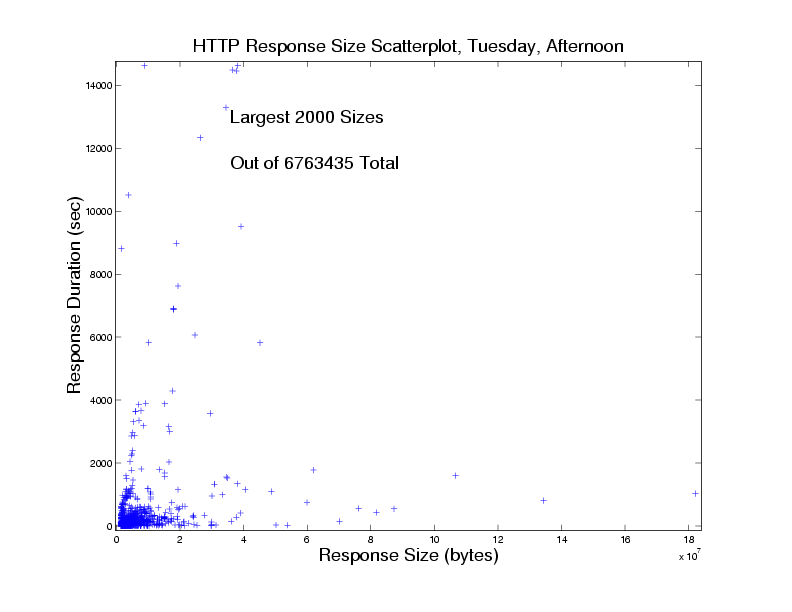
Figure 57. UNC2001RS1SPTScombine.
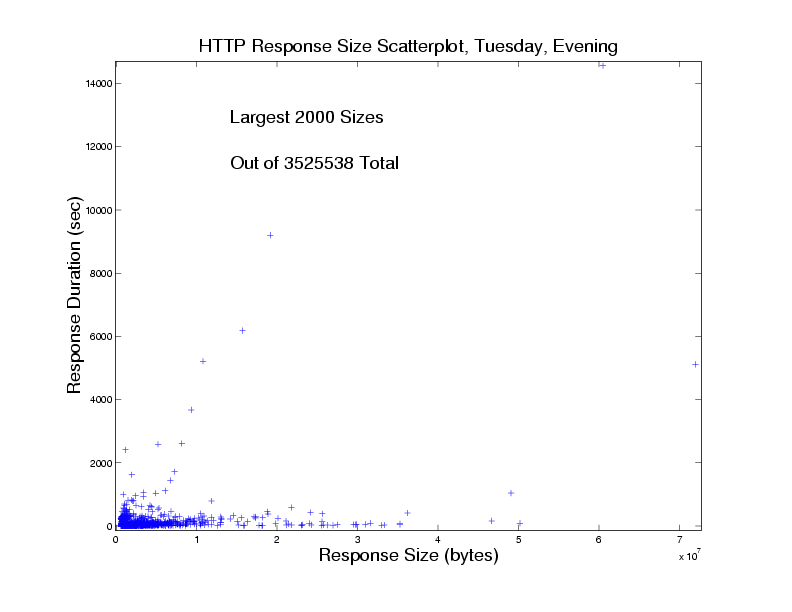
Figure 58. UNC2001RS1SPTScombine.
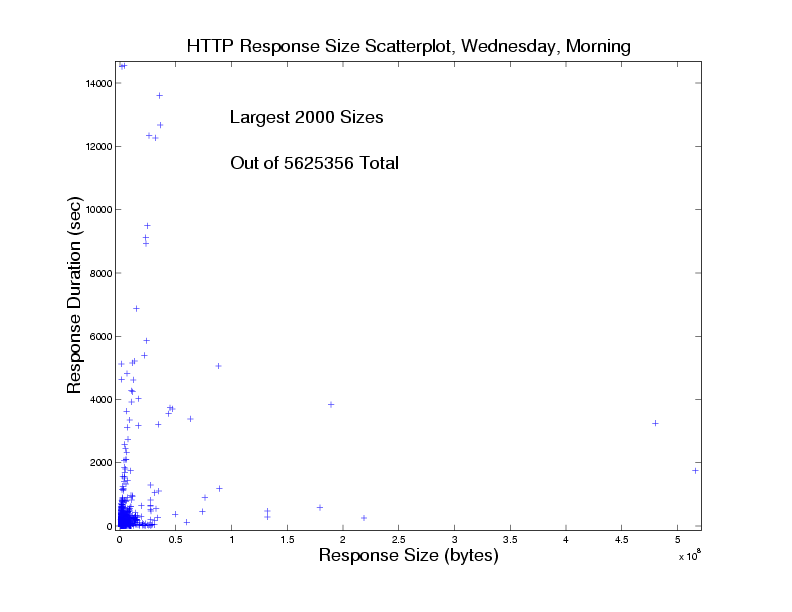
Figure 59. UNC2001RS1SPTScombine.
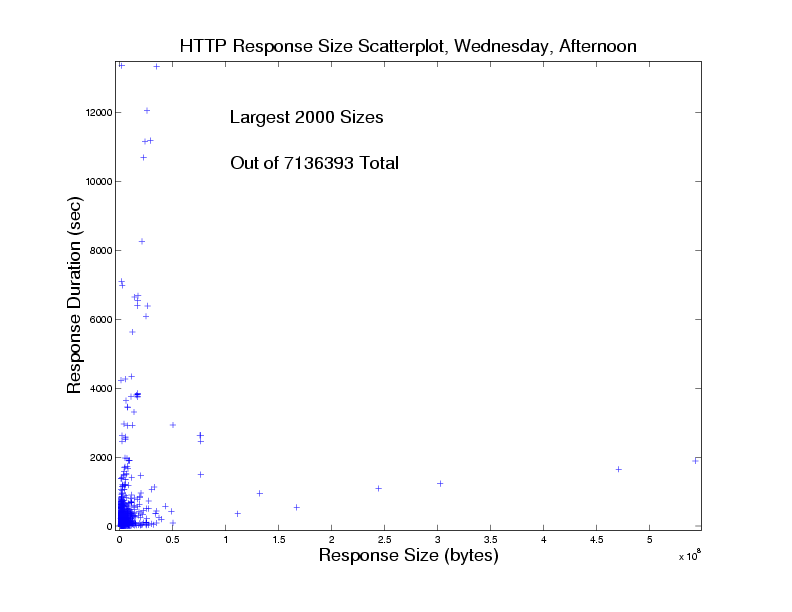
Figure 60. UNC2001RS1SPTScombine.
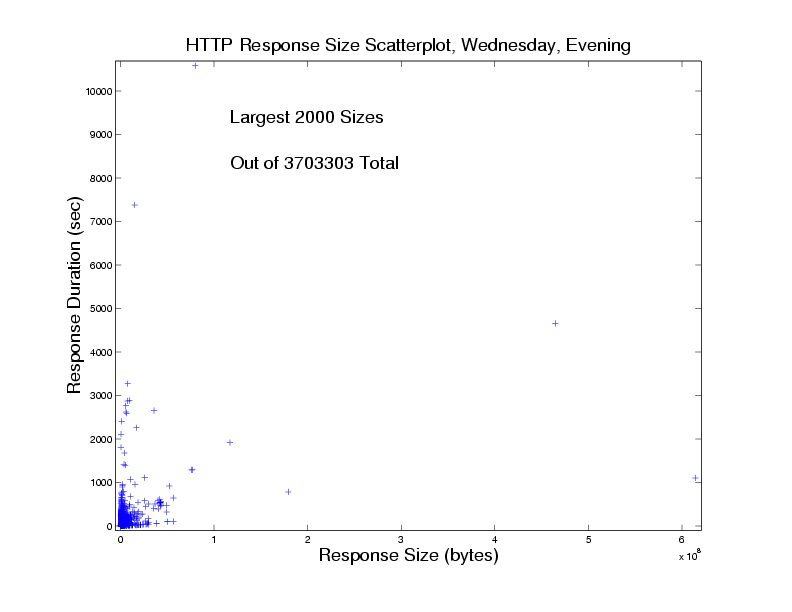
Figure 61. UNC2001RS1SPTScombine.
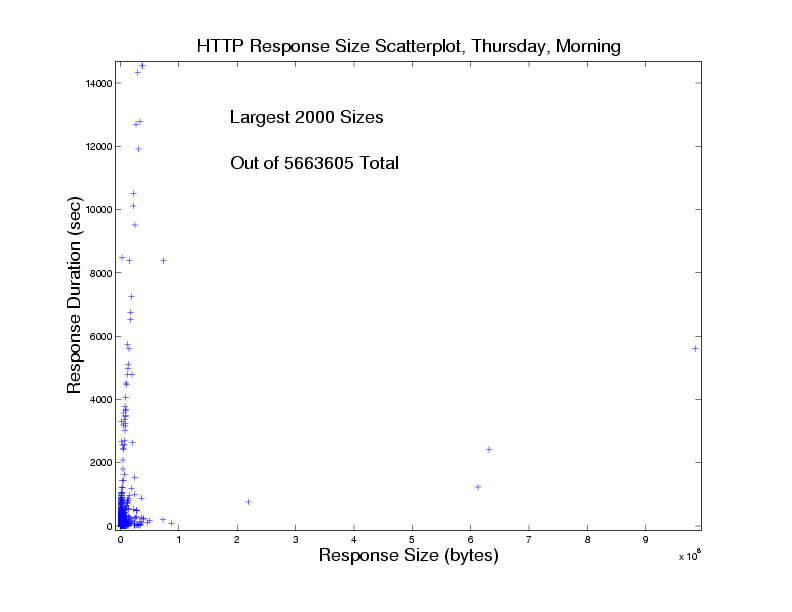
Figure 62. UNC2001RS1SPTScombine.
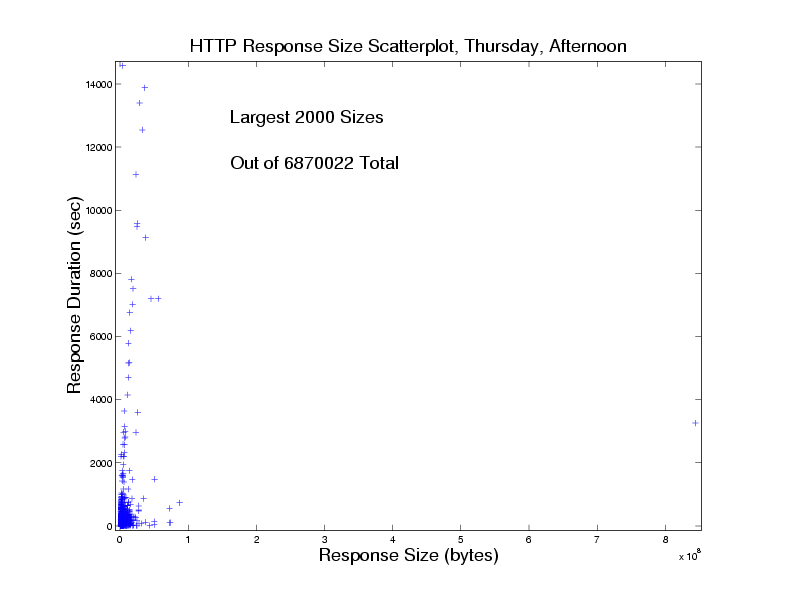
Figure 63. UNC2001RS1SPTScombine.
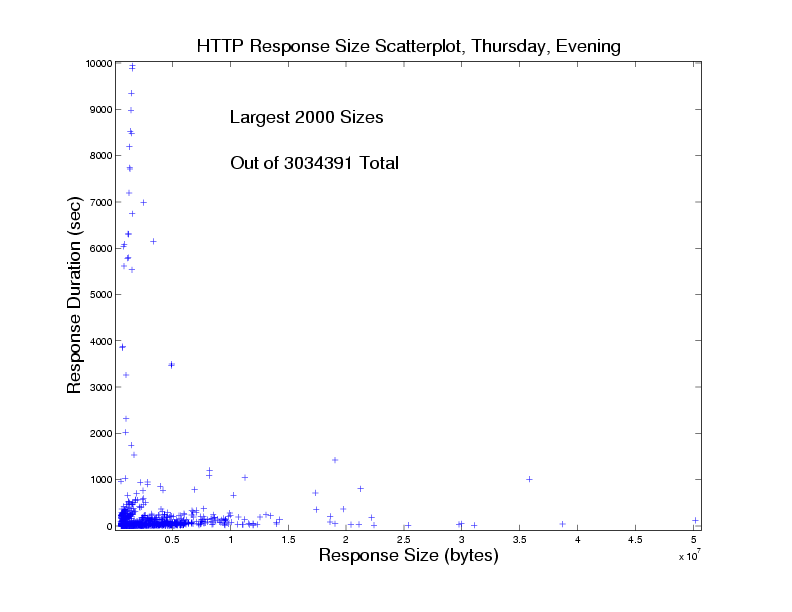
Figure 64. UNC2001RS1SPTScombine.
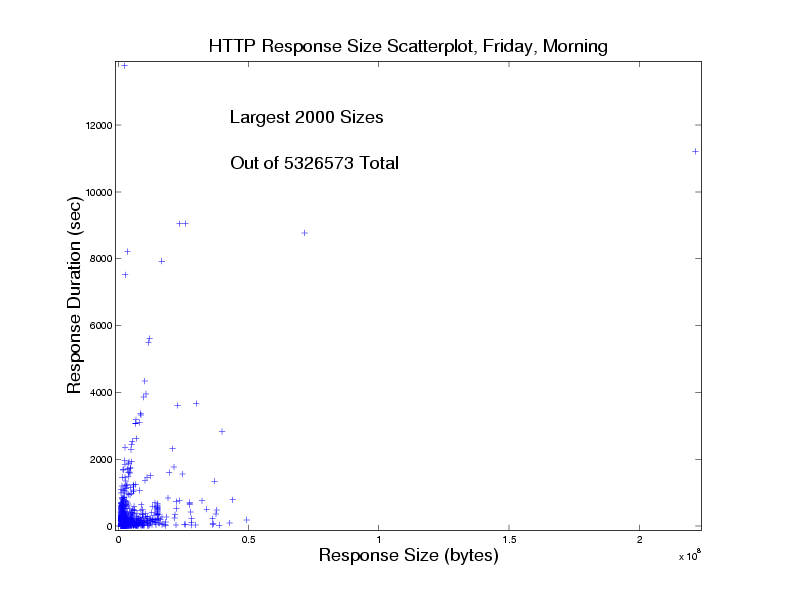
Figure 65. UNC2001RS1SPTScombine.
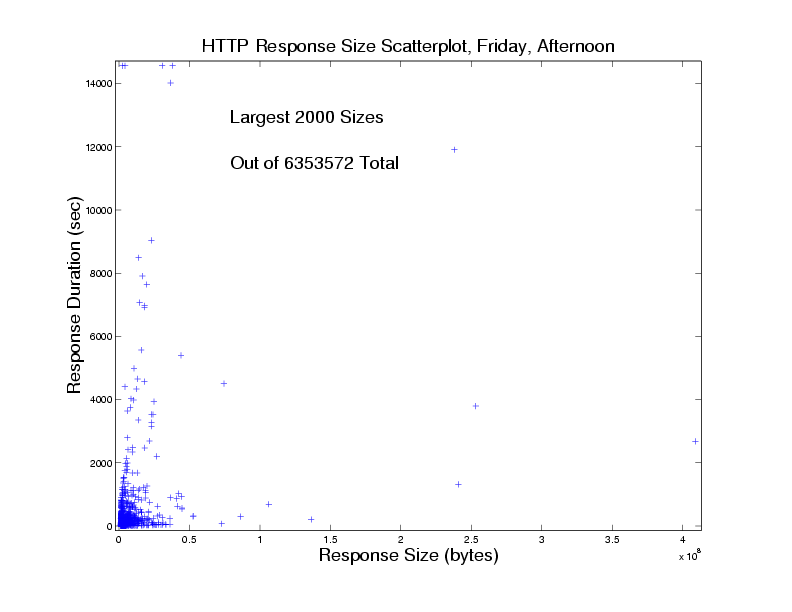
Figure 66. UNC2001RS1SPTScombine.
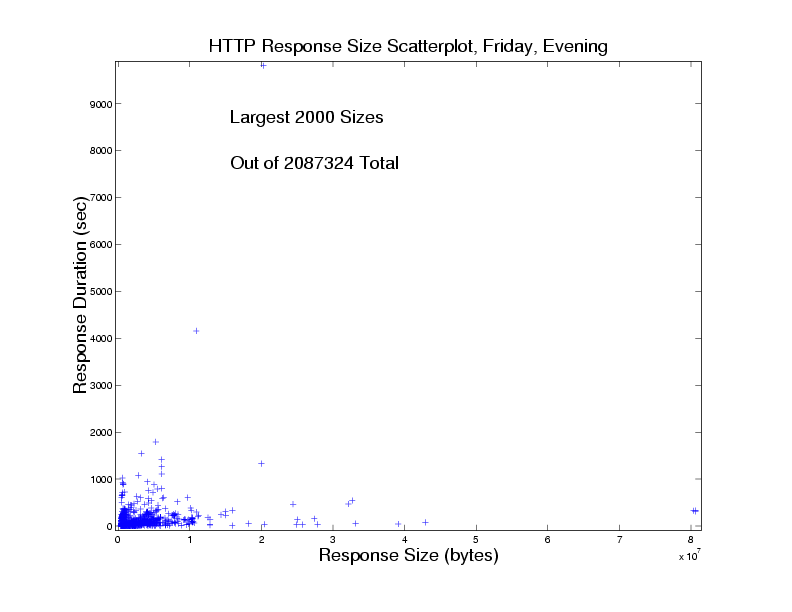
Figure 67. UNC2001RS1SPTScombine.
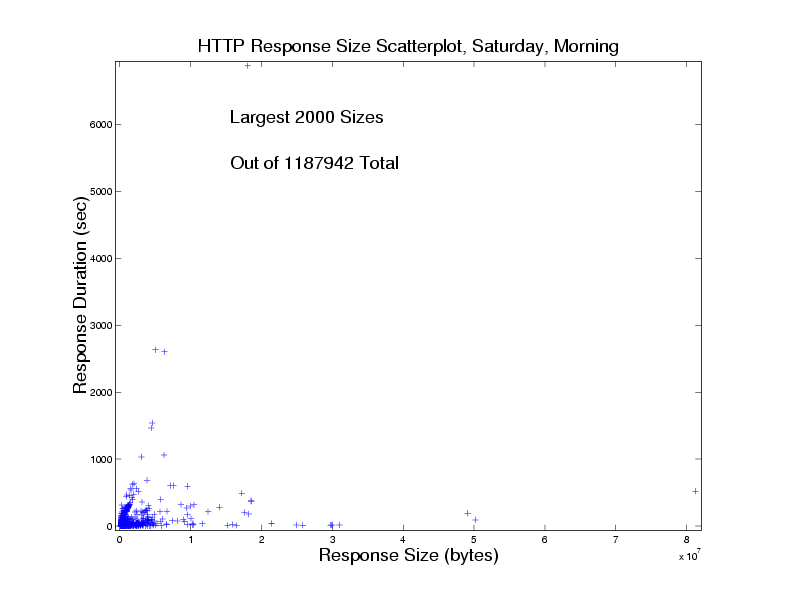
Figure 68. UNC2001RS1SPTScombine.
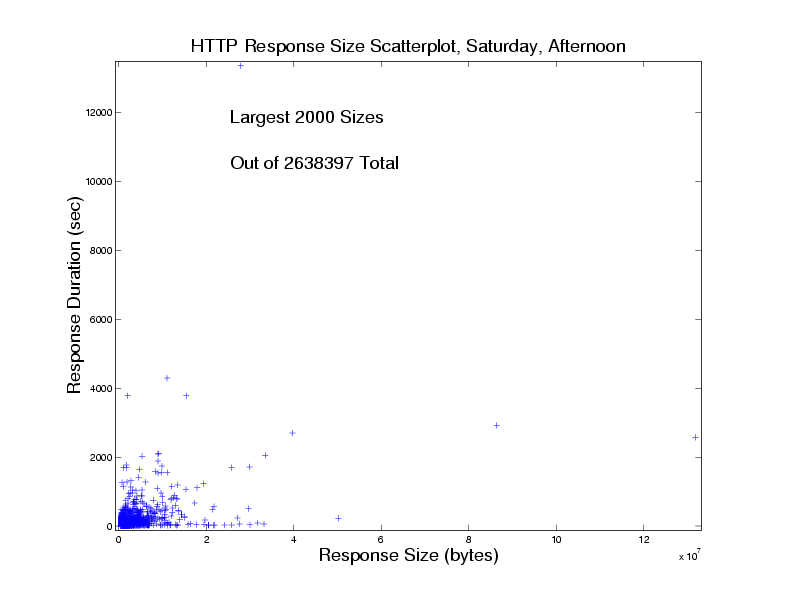
Figure 69. UNC2001RS1SPTScombine.
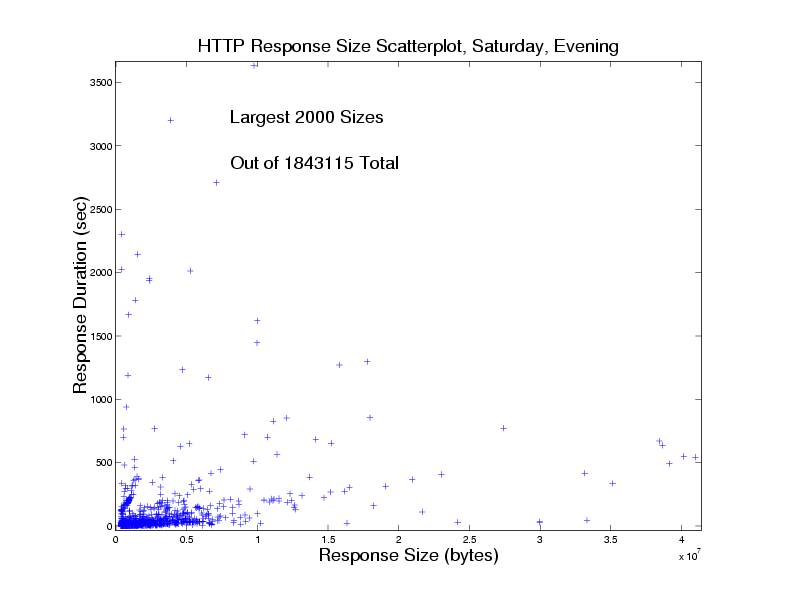
Figure 70. UNC2001RS1SPTScombine.
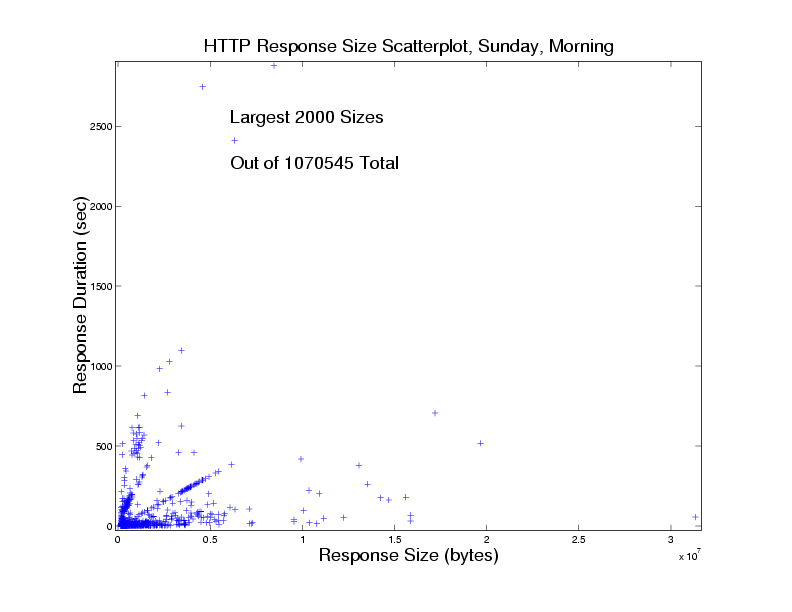
Figure 71. UNC2001RS1SPTScombine.
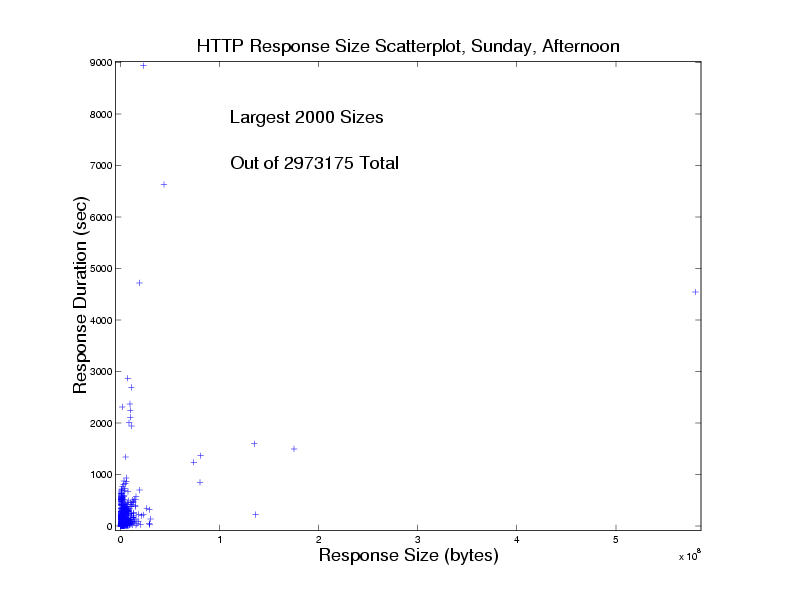
Figure 72. UNC2001RS1SPTScombine.
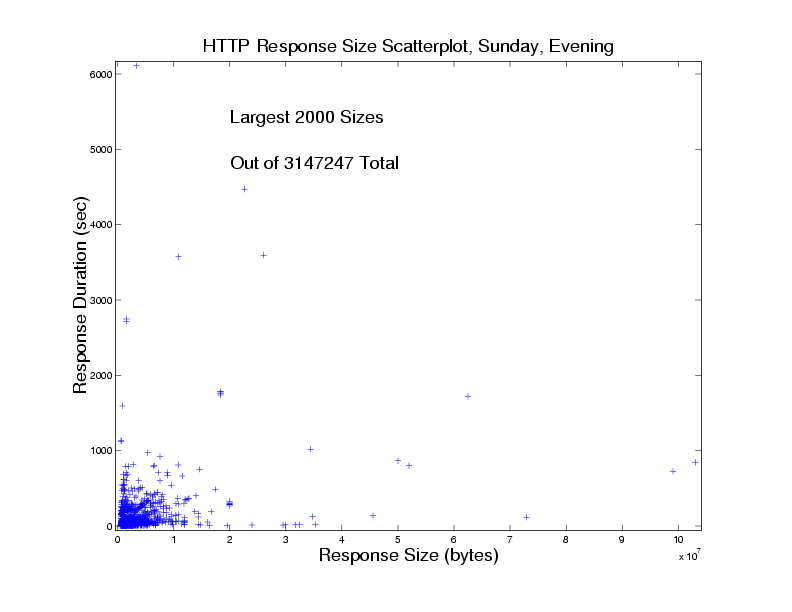
Figure 73. UNC2001RS1SPTScombine.
Félix Hernández-Campos, J. S. Marron, Sidney I. Resnick, Kevin Jeffay
Last modified: Wed May 21 11:12:55 EDT 2003
|

|